Skip to content
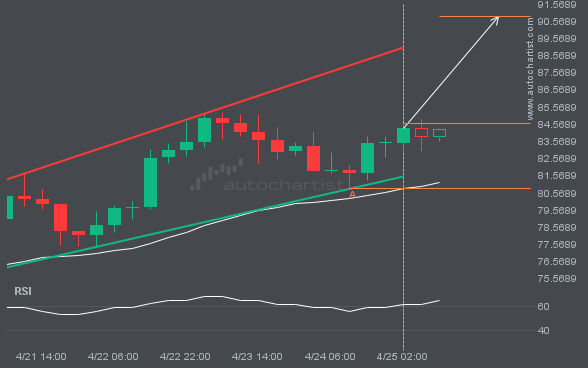
LTCUSD is heading towards the resistance line of a Channel Up. If this movement continues, the price of LTCUSD could test 90.8387 within the next 17 hours. It has tested this line numerous times in the past, so this movement could be short-lived and end up rebounding just like it did in the past.
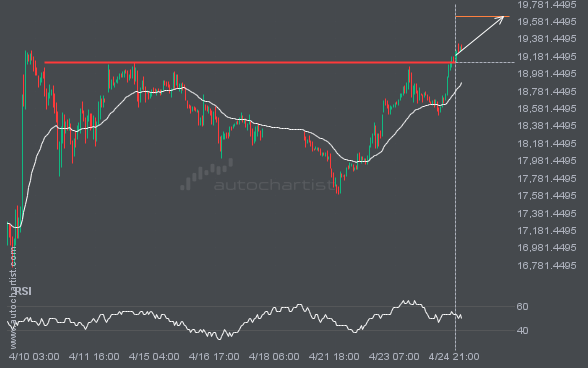
NAS100 has broken through a line of 19115.4219. If this breakout holds true, we could see the price of NAS100 heading towards 19637.4531 within the next 3 days. But don’t be so quick to trade, it has tested this line numerous times in the past, so you should probably confirm the breakout before placing any […]
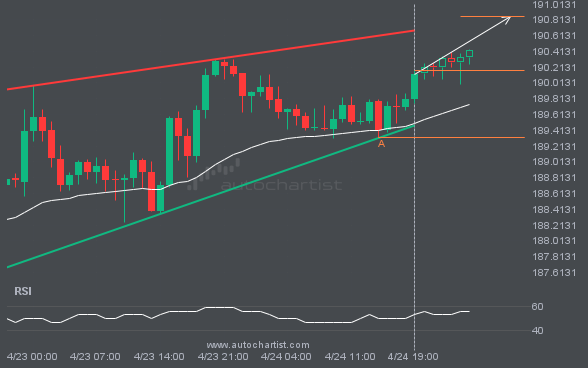
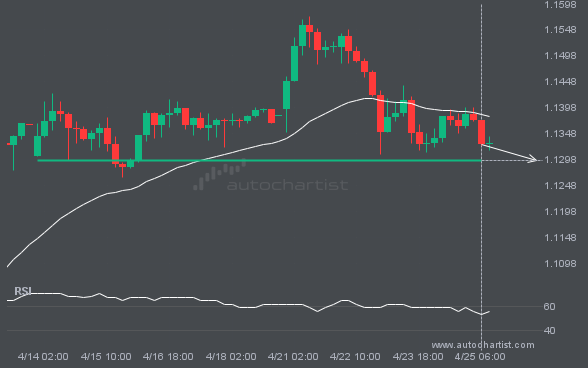
GBPJPY is moving towards a resistance line which it has tested numerous times in the past. We have seen it retrace from this line before, so at this stage it isn’t clear whether it will breach this line or rebound as it did before. If GBPJPY continues in its current trajectory, we could see it […]
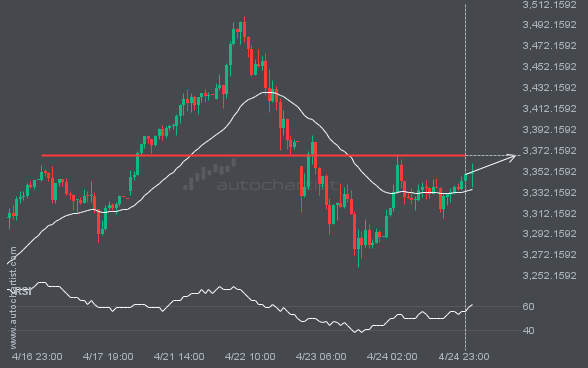
XAUUSD is about to retest a key horizontal resistance level near 3367.6699. It has tested this level 3 times in the recent past and could simply bounce off like it did last time. However, after this many tries, maybe it’s ready to start a new trend.