Skip to content
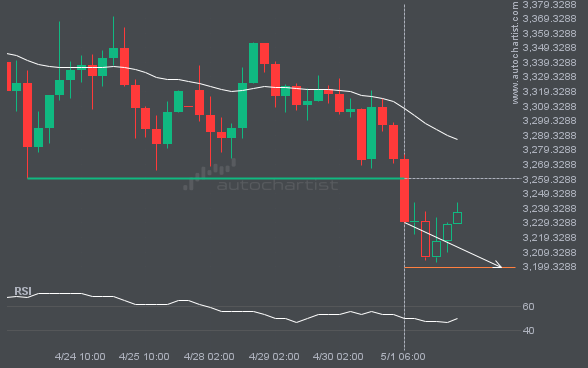
 ETHUSD has broken through the resistance line of a Channel Down technical chart pattern. Because we have seen it retrace from this line in the past, one should wait for confirmation of the breakout before taking any action. It has touched this line twice in the last 8 days and suggests a possible target level […]
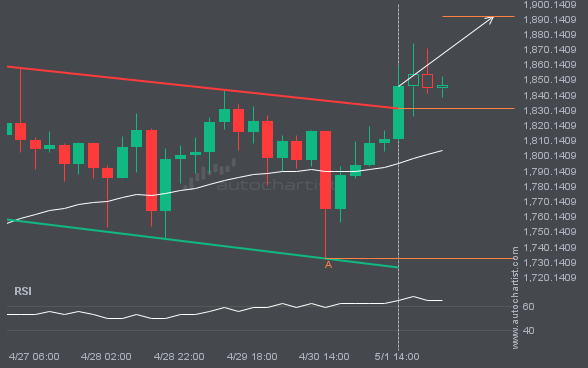
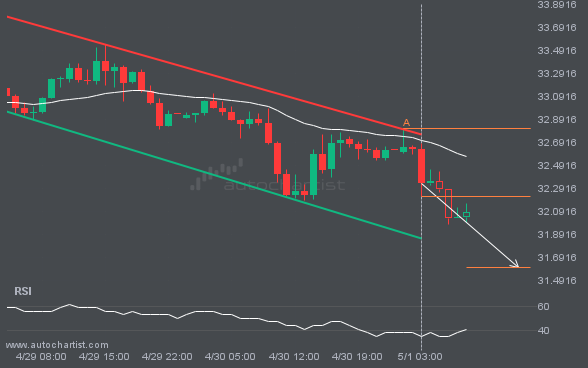
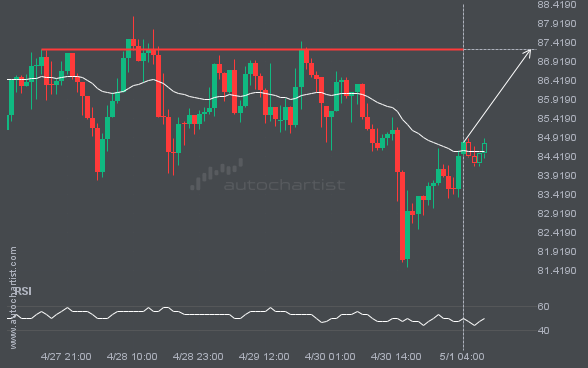
XAGUSD is moving towards a support line which it has tested numerous times in the past. We have seen it retrace from this line before, so at this stage it isn’t clear whether it will breach this line or rebound as it did before. If XAGUSD continues in its current trajectory, we could see it […]
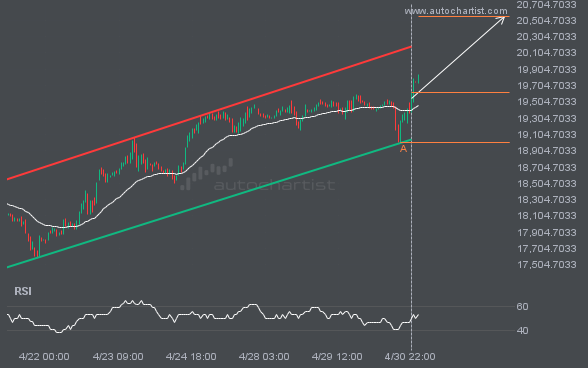
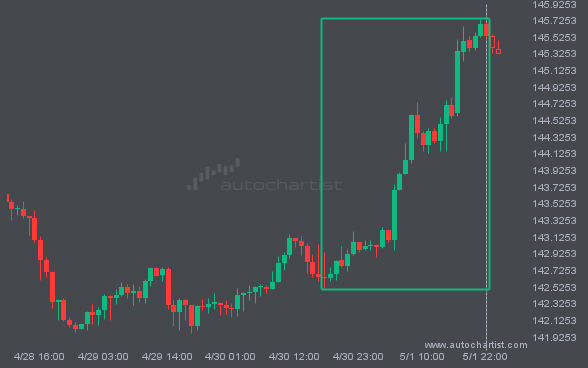
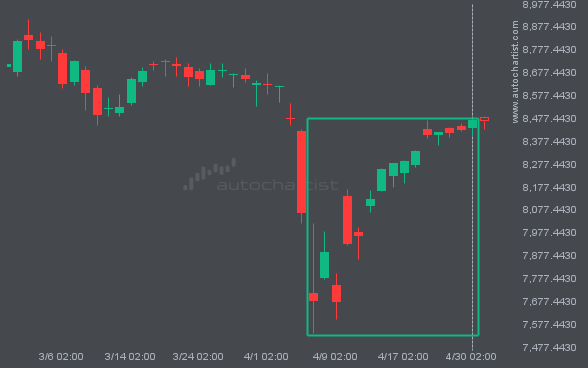
A Channel Up pattern was identified on NAS100 at 19615.3276, creating an expectation that it may move to the resistance line at 20550.7849. It may break through that line and continue the bullish trend or it may reverse from that line.