Skip to content
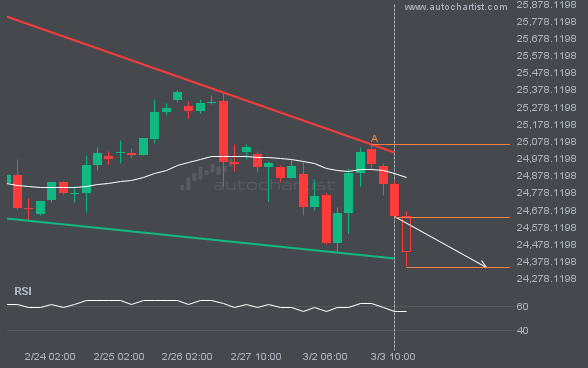
 The movement of NAS100 toward the support line of a Falling Wedge is yet another test of the line it has reached numerous times in the past. This test of the line could occur within the next 2 days, but it is uncertain whether it will result in a breakout through this line or simply […]
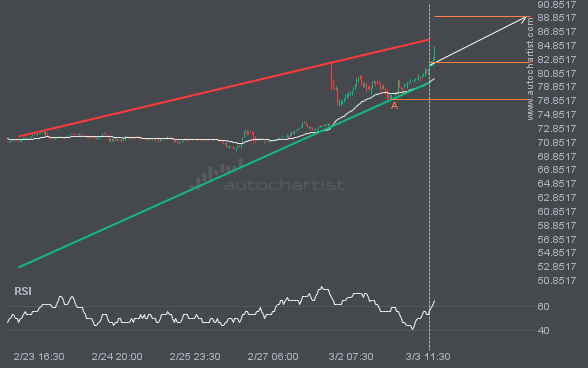
BRN/USD is moving toward a resistance line. Since it has retraced from this line before, we may see either a breakout through this line or a rebound to current levels. It has touched this line numerous times in the last 9 days and may test it again within the next 2 days.
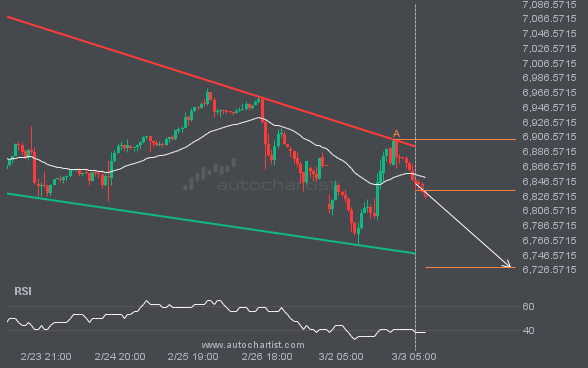
S&P500 was identified around 6833.78 after recently rebounding off the resistance on the 1 hour interval. Ultimately, the stock’s price action has formed a Falling Wedge pattern. This squeeze may increase the chances of a strong breakout. The projected move could take the price to around 6729.9590.
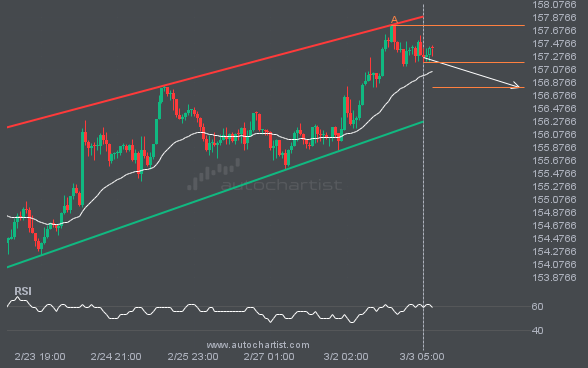
USDJPY is moving toward a support line it has tested many times. It has retraced from this line before, so it’s unclear whether it will break through or rebound again. If USDJPY continues on its current trajectory, it could reach 156.7928 within the next 2 days.
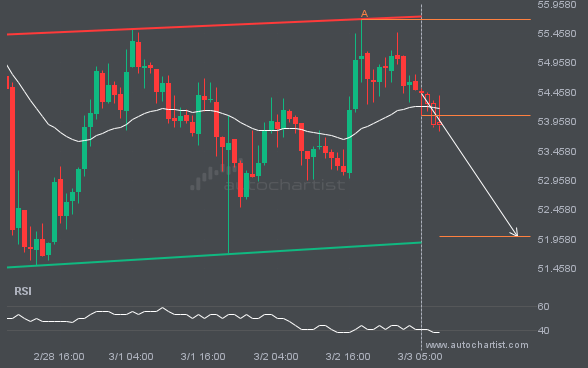
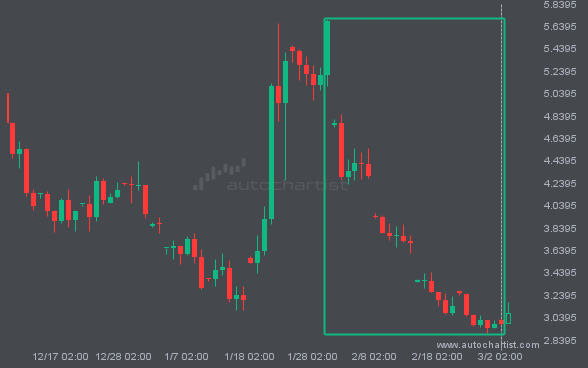
An emerging Rectangle pattern has been detected for LTCUSD on the 1 hour chart. There may be a move toward 52.0100 in the next few candles. Once it reaches the support, it may continue its bearish run or revert to current price levels.
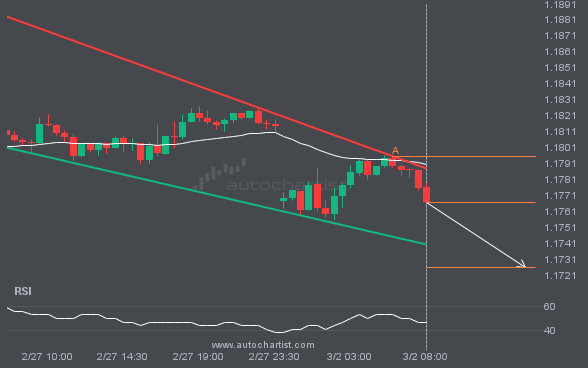
EURUSD is heading toward the support line in a Falling Wedge pattern. If this move continues, the price of EURUSD could test 1.1726 within the next 7 hours. It has tested this line many times before, so the move could be short-lived and may rebound as it has before.