 Skip to content
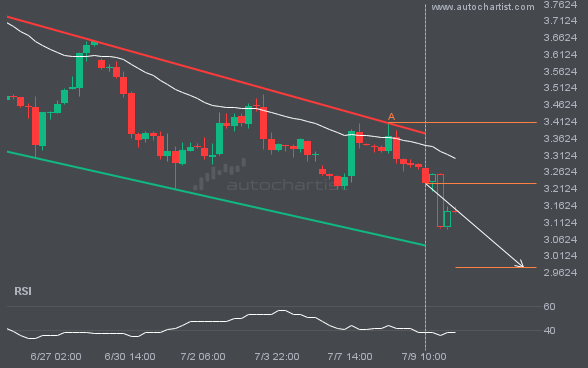
 The movement of NGC/USD towards the support line of a Channel Down is yet another test of the line it reached numerous times in the past. This line test could happen in the next 3 days, but it is uncertain whether it will result in a breakout through this line, or simply rebound back to […]
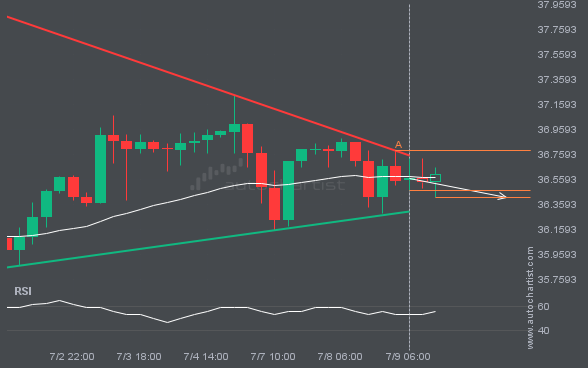
XAGUSD is heading towards the support line of a Triangle. If this movement continues, the price of XAGUSD could test 36.4123 within the next 2 days. It has tested this line numerous times in the past, so this movement could be short-lived and end up rebounding just like it did in the past.
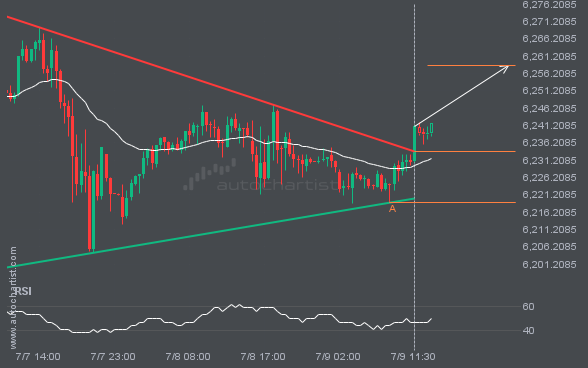
S&P500 has broken through the resistance line of a Triangle technical chart pattern. Because we have seen it retrace from this line in the past, one should wait for confirmation of the breakout before taking any action. It has touched this line twice in the last 3 days and suggests a possible target level to […]
LTCUSD is moving towards a resistance line. Because we have seen it retrace from this line before, we could see either a break through this line, or a rebound back to current levels. It has touched this line numerous times in the last 22 hours and may test it again within the next 5 hours.
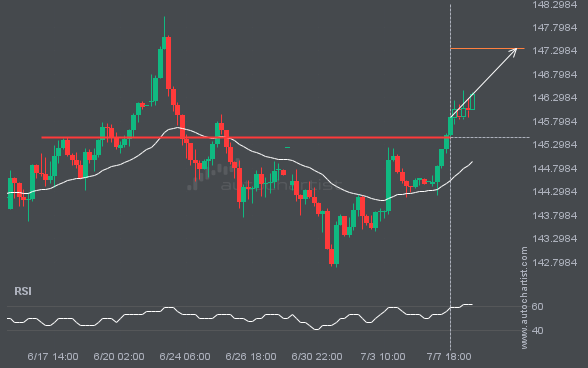
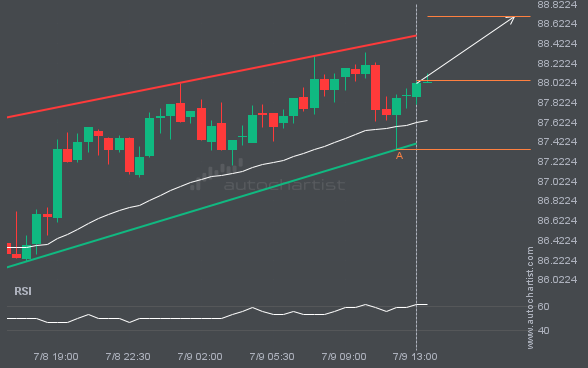
USDJPY has broken through a line of 145.4435. If this breakout holds true, we could see the price of USDJPY heading towards 147.3497 within the next 3 days. But don’t be so quick to trade, it has tested this line numerous times in the past, so you should probably confirm the breakout before placing any […]
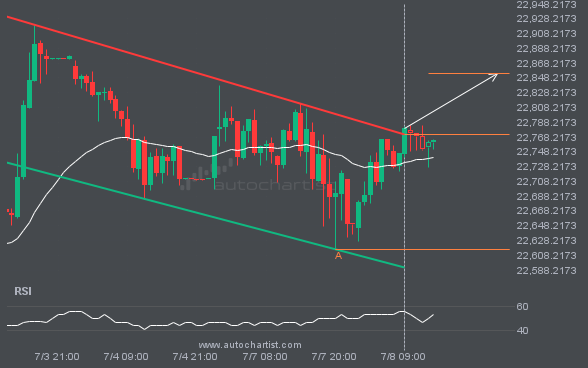
Channel Down pattern identified on NAS100 has broken through a resistance level with the price momentum continuing to move in an upward direction. A solid trading opportunity continues with the price expected to reach 22854.4524 in the next 16.
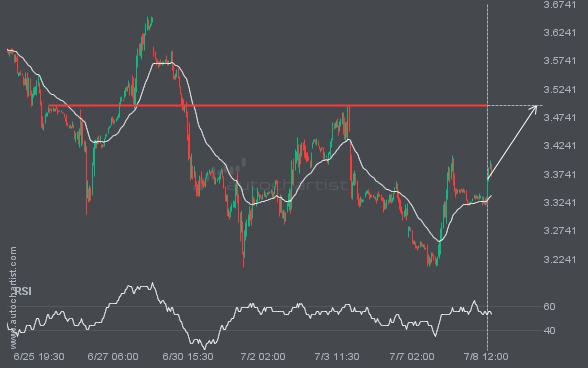
The movement of NGC/USD towards 3.4945 price line is yet another test of the line it reached numerous times in the past. We could expect this test to happen in the next 2 days, but it is uncertain whether it will result in a breakout through this line, or simply rebound back to current lines.

