Skip to content
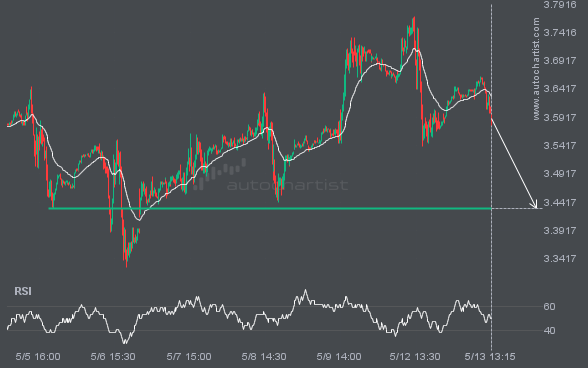
The price of NGC/USD in heading back to the support area. It is possible that it will struggle to break through it and move back in the other direction. The price may eventually break through, but typically the price retreats from the level a number of times before doing so.
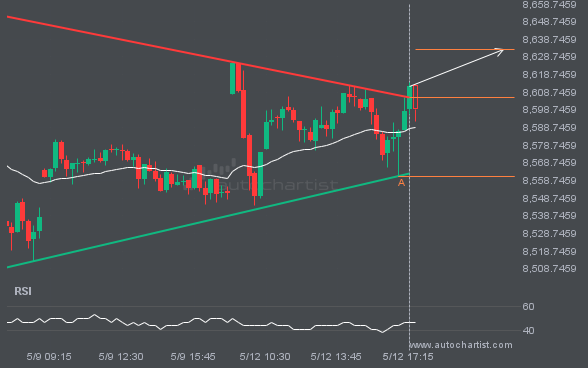
FTSE100 has broken through a resistance line. It has touched this line at least twice in the last 5 days. This breakout may indicate a potential move to 8633.2325 within the next 5 hours. Because we have seen it retrace from this position in the past, one should wait for confirmation of the breakout before […]
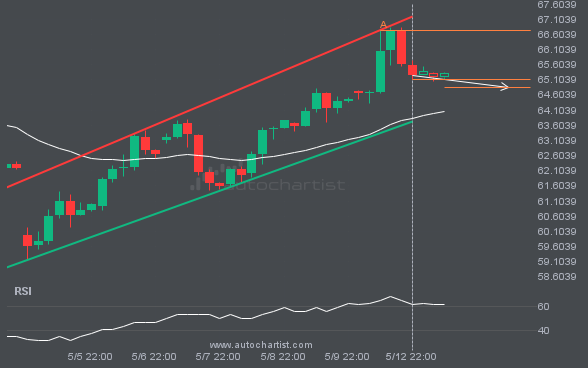
BRN/USD is heading towards the support line of a Channel Up and could reach this point within the next 2 days. It has tested this line numerous times in the past, and this time could be no different from the past, ending in a rebound instead of a breakout. If the breakout doesn’t happen, we […]
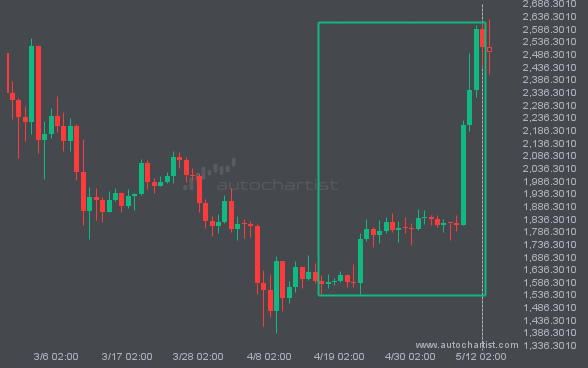
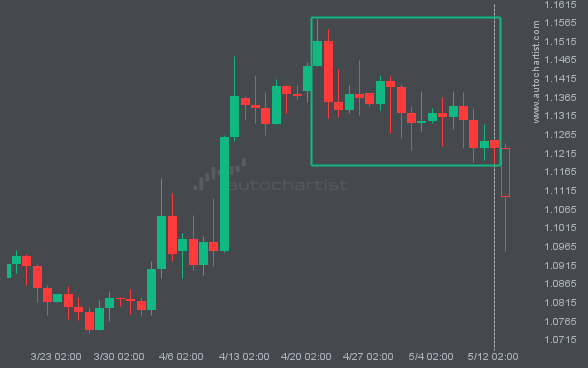
A movement of 59.44% over 27 days on ETHUSD doesn’t go unnoticed. You may start considering where it’s heading next, a continuation of the current upward trend, or a reversal in the previous direction.
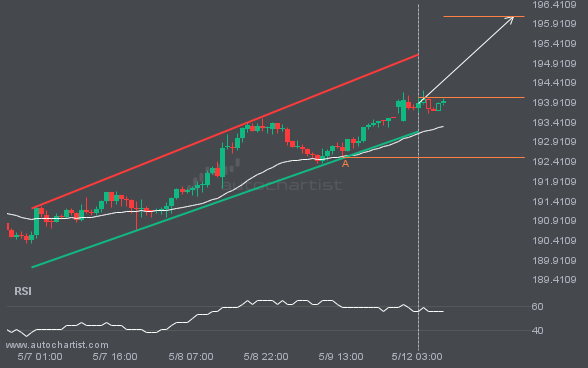
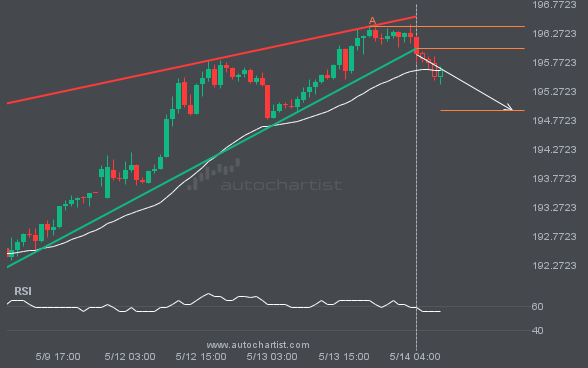
GBPJPY was identified at around 194.0515 having recently rebounded of the support on the 1 hour data interval. Ultimately, the price action of the stock has formed a Channel Up pattern. This squeeze may increases the chances of a strong breakout. The projected movement will potentially take the price to around the 196.0927 level.