Skip to content
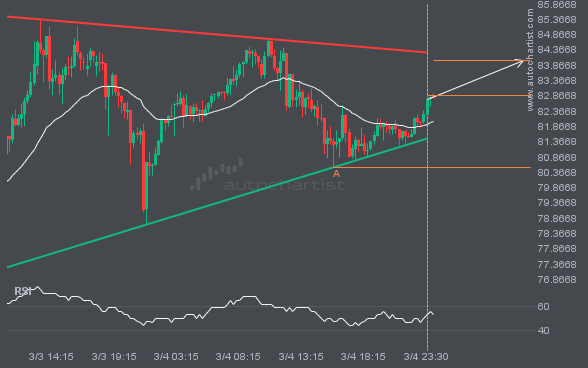
BRN/USD is moving toward a resistance line it has tested many times. It has retraced from this line before, so it’s unclear whether it will break through or rebound again. If BRN/USD continues on its current trajectory, it could reach 84.0085 within the next 10 hours.
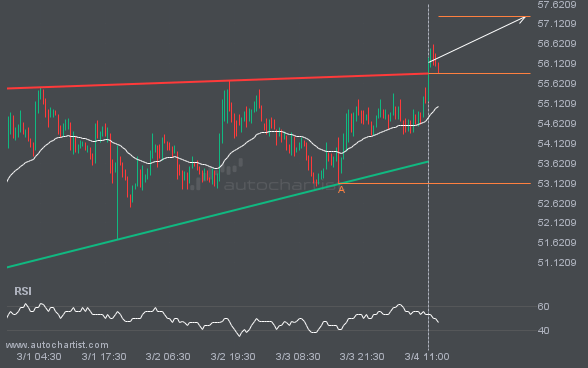
Ascending Triangle pattern identified on LTCUSD has broken through a resistance level, with price momentum continuing to move upward. This presents a solid trading opportunity, with the price expected to reach 57.3057 in the next 23.
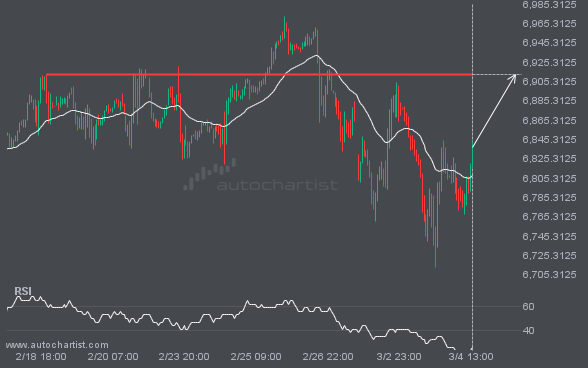
S&P500 is moving toward a level at 6912.7402, which it has tested many times before. We have seen it retrace from this level before, so at this stage it isn’t clear whether it will break through this price or rebound again. If S&P500 continues on its current trajectory, we may see it move toward 6912.7402 […]
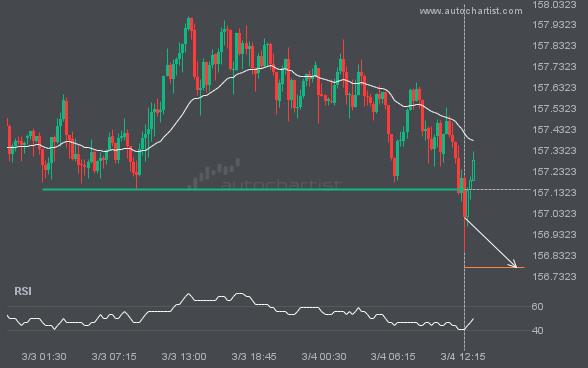
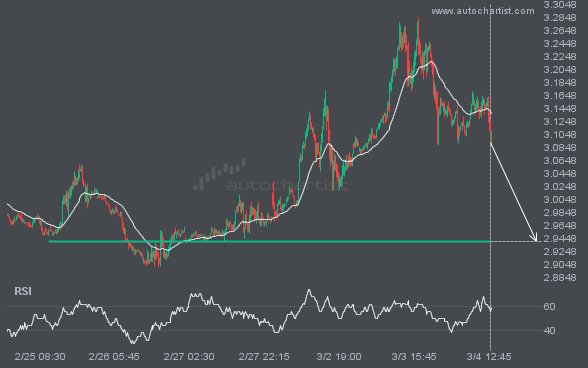
USDJPY has broken through a support line. Because it has previously retraced from this price, you should wait for confirmation of the breakout before trading. It has touched this line multiple times over the past 2 days, which suggests a possible target around 156.7770 within the next 7 hours.
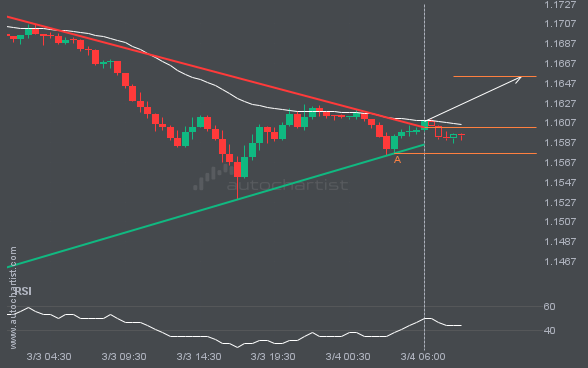
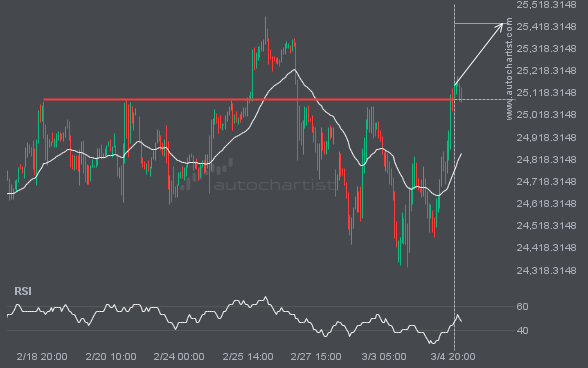
EURUSD has broken through the resistance line, which it has tested twice before. We have seen it retrace from this line before, so wait for confirmation of the breakout before trading. If this new trend persists, a target level around 1.1654 may materialize within the next 6 hours.