 Skip to content
 ETHUSD is heading towards a line of 2439.7800. If this movement continues, the price of ETHUSD could test 2439.7800 within the next 19 hours. But don’t be so quick to trade, it has tested this line numerous times in the past, so this movement could be short-lived and end up rebounding.

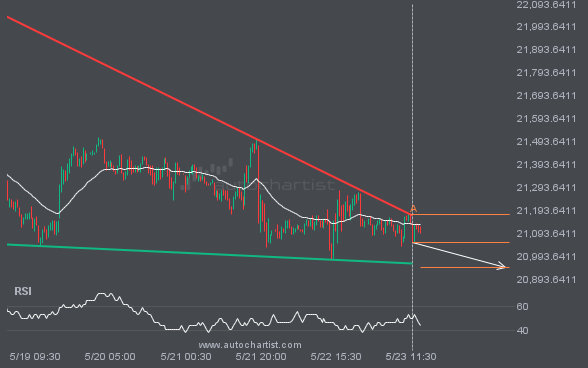
NAS100 is heading towards the support line of a Falling Wedge. If this movement continues, the price of NAS100 could test 20945.6490 within the next 2 days. It has tested this line numerous times in the past, so this movement could be short-lived and end up rebounding just like it did in the past.
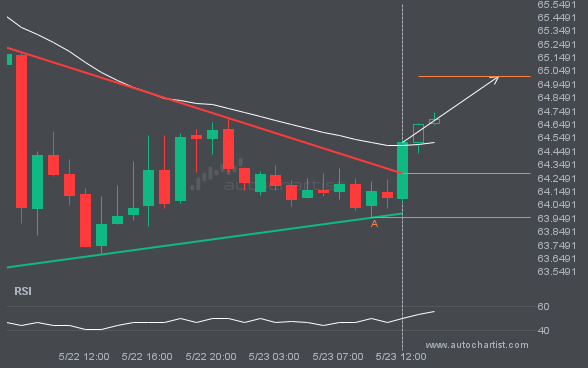
This trade setup on BRN/USD is formed by a period of consolidation; a period in which the price primarily moves sideways before choosing a new direction for the longer term. Because of the bullish breakout through resistance, it seems to suggest that we could see the next price move to 65.0051.
LTCUSD is moving towards a resistance line which it has tested numerous times in the past. We have seen it retrace from this line before, so at this stage it isn’t clear whether it will breach this line or rebound as it did before. If LTCUSD continues in its current trajectory, we could see it […]
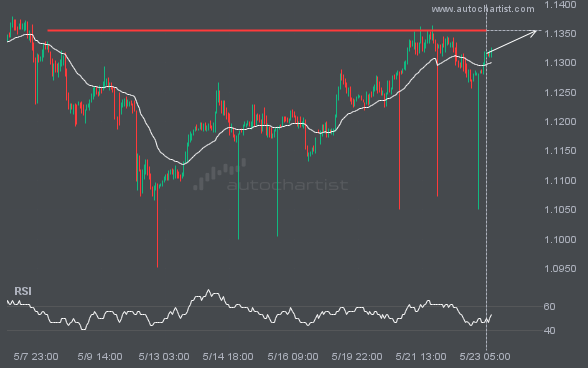
The price of EURUSD in heading back to the resistance area. It is possible that it will struggle to break through it and move back in the other direction. The price may eventually break through, but typically the price retreats from the level a number of times before doing so.
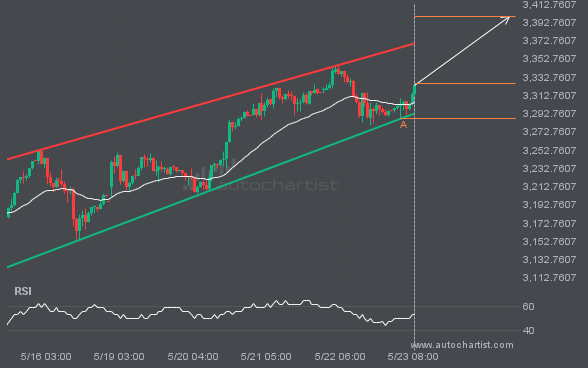
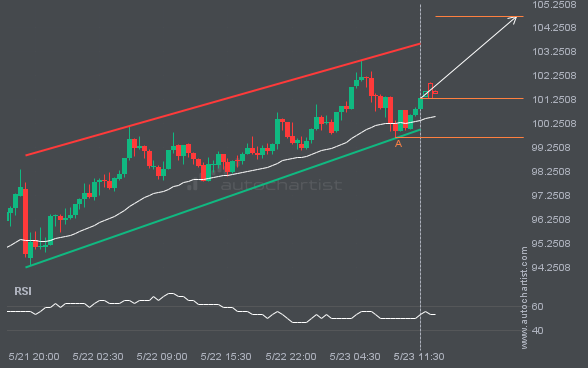
A Channel Up pattern was identified on XAUUSD at 3325.76, creating an expectation that it may move to the resistance line at 3399.0149. It may break through that line and continue the bullish trend or it may reverse from that line.
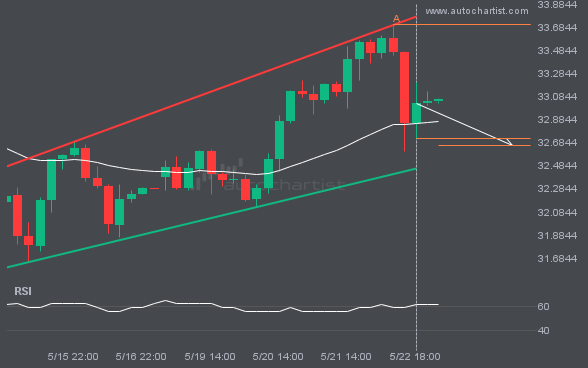
A Channel Up pattern was identified on XAGUSD at 32.71975, creating an expectation that it may move to the support line at 32.6595. It may break through that line and continue the bearish trend or it may reverse from that line.

