Skip to content
 BTCUSD is approaching the resistance line of a Channel Up. It has touched this line numerous times in the last 4 days. If it tests this line again, it should do so in the next 19 hours.
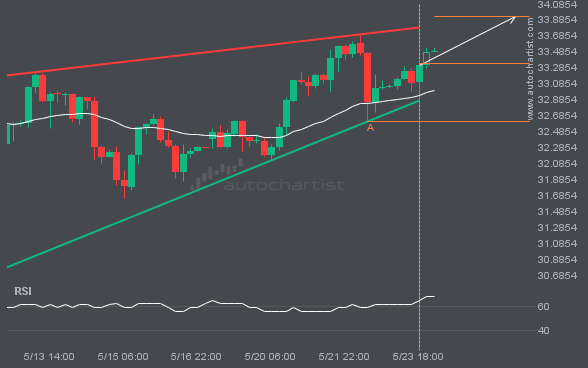
EURUSD is trapped in a Rising Wedge formation, implying that a breakout is Imminent. This is a great trade-setup for both trend and swing traders. It is now approaching a support line that has been tested in the past. Divergence opportunists may be very optimistic about a possible breakout and this may be the start […]
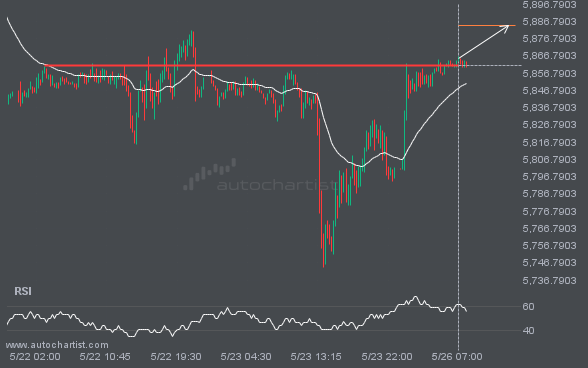
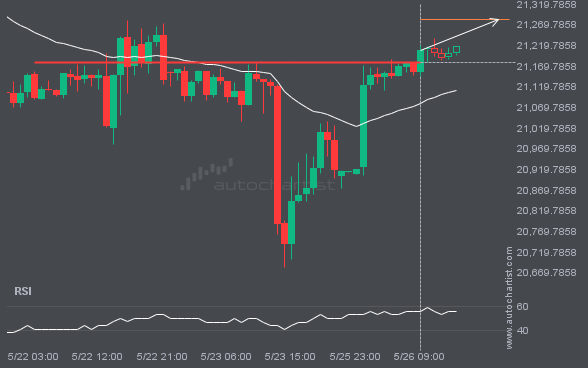
The breakout of S&P500 through the 5861.2402 price line is a breach of an important psychological price that is has tested numerous in the past. If this breakout persists, S&P500 could test 5884.4248 within the next 11 hours. One should always be cautious before placing a trade, wait for confirmation of the breakout.
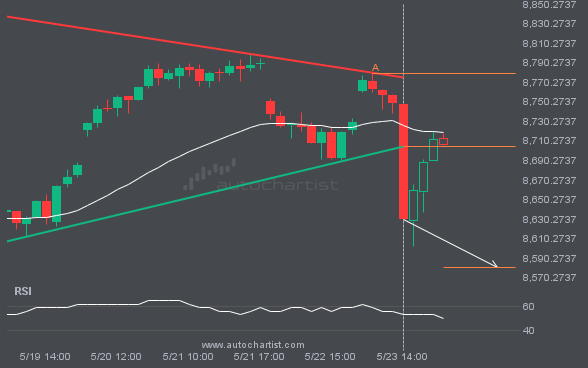
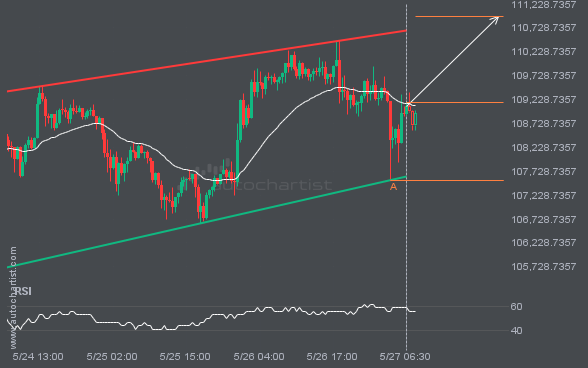
FTSE100 has broken through a support line of a Triangle chart pattern. If this breakout holds true, we may see the price of FTSE100 testing 8580.9758 within the next 8 hours. But don’t be so quick to trade, it has tested this line in the past, so you should confirm the breakout before taking any […]
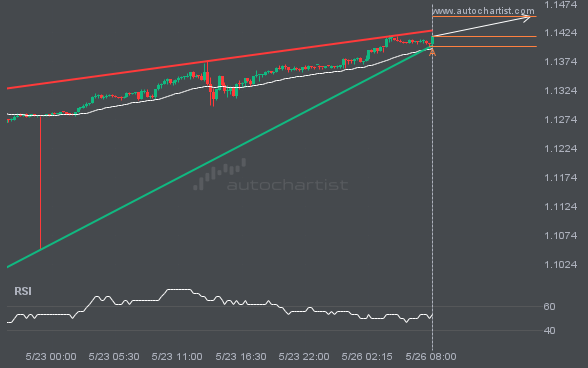
GBPJPY is moving towards a support line. Because we have seen it retrace from this line before, we could see either a break through this line, or a rebound back to current levels. It has touched this line numerous times in the last 10 days and may test it again within the next 2 days.