Skip to content
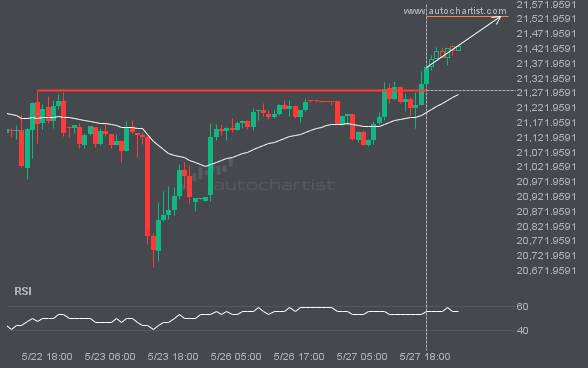
NAS100 has broken through a line of 21279.5000 and suggests a possible movement to 21529.6035 within the next 11 hours. It has tested this line numerous times in the past, so one should wait for a confirmation of this breakout before taking any action. If the breakout doesn’t confirm, we could see a retracement back […]
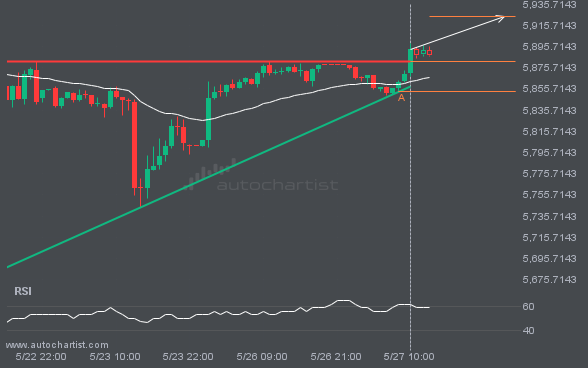
The breakout of S&P500 through the resistance line of a Ascending Triangle could be a sign of the road ahead. If this breakout persists, we may see the price of S&P500 testing 5923.8800 within the next 16 hours.
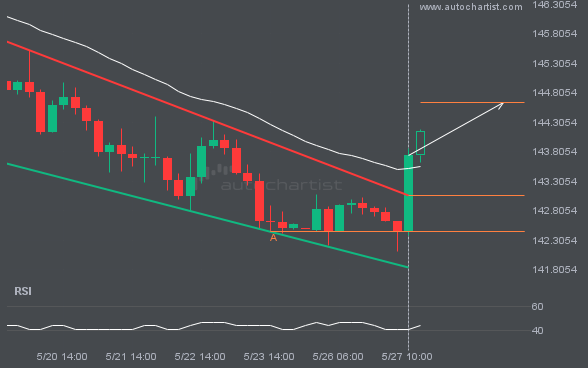
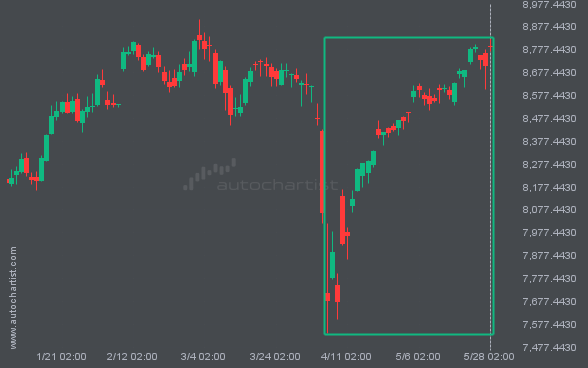
This trade setup on USDJPY is formed by a period of consolidation; a period in which the price primarily moves sideways before choosing a new direction for the longer term. Because of the bullish breakout through resistance, it seems to suggest that we could see the next price move to 144.6464.
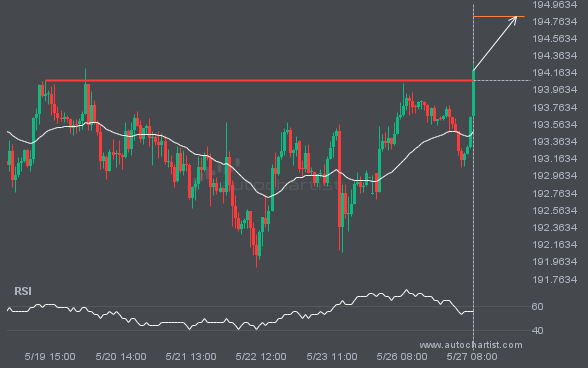
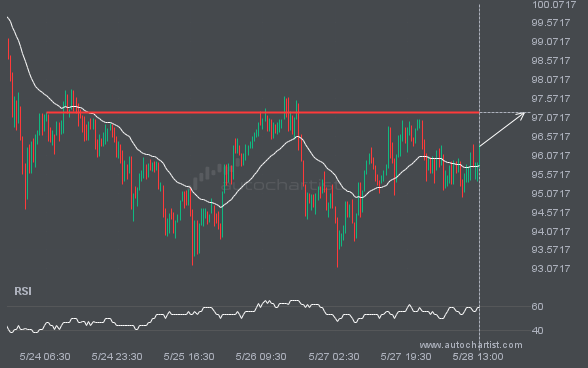
The breakout of GBPJPY through the 194.0700 price line is a breach of an important psychological price that is has tested numerous in the past. If this breakout persists, GBPJPY could test 194.8174 within the next 2 days. One should always be cautious before placing a trade, wait for confirmation of the breakout.