Skip to content
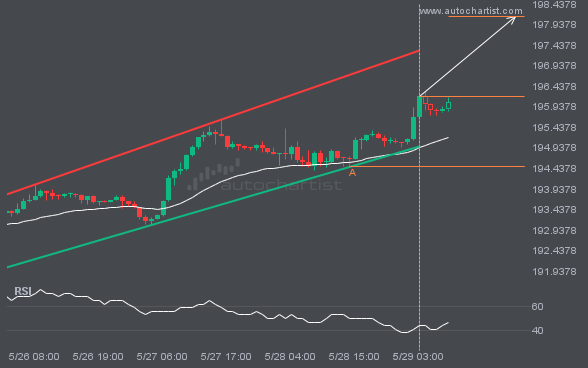
 Emerging Channel Up detected on GBPJPY – the pattern is an emerging one and has not yet broken through support, but the price is expected to move up over the next few hours. The price at the time the pattern was found was 196.1925 and it is expected to move to 198.1327.
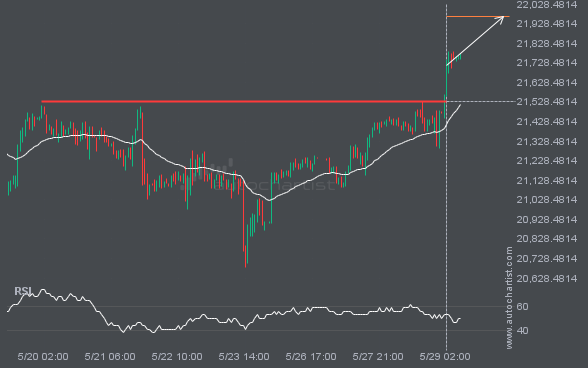
The breakout of NAS100 through the 21531.2891 price line is a breach of an important psychological price that is has tested numerous in the past. If this breakout persists, NAS100 could test 21964.3867 within the next 2 days. One should always be cautious before placing a trade, wait for confirmation of the breakout.
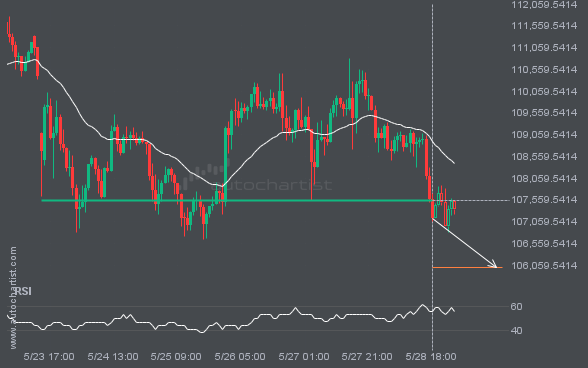
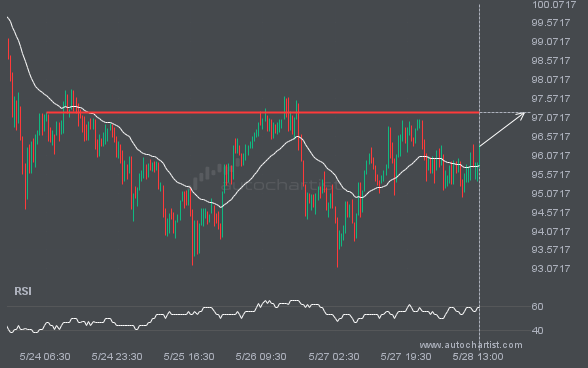
BTCUSD has broken through a line of 107543.8281 and suggests a possible movement to 106005.6328 within the next 23 hours. It has tested this line numerous times in the past, so one should wait for a confirmation of this breakout before taking any action. If the breakout doesn’t confirm, we could see a retracement back […]
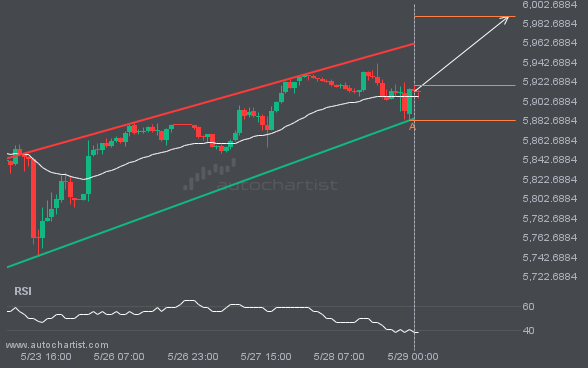
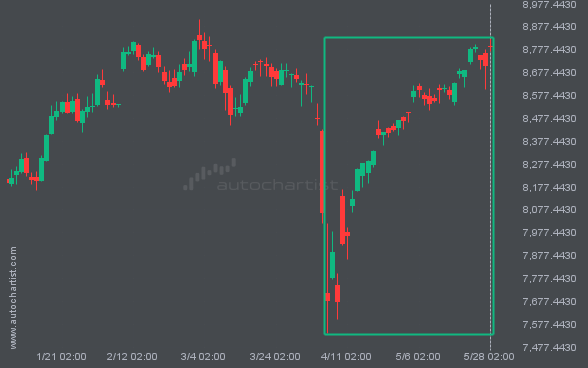
Emerging Channel Up pattern in its final wave was identified on the S&P500 1 hour chart. After a strong bullish run, we find S&P500 heading towards the upper triangle line with a possible resistance at 5989.8030. If the resistance shows to hold, the Channel Up pattern suggests a rebound back towards current levels.
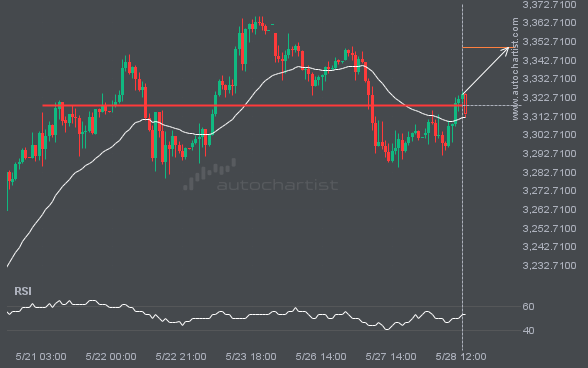
XAUUSD has broken through 3318.3350 which it has tested numerous times in the past. We have seen it retrace from this price in the past. If this new trend persists, XAUUSD may be heading towards 3349.5090 within the next 2 days.