Skip to content
 Emerging Channel Up detected on NGC/USD – the pattern is an emerging one and has not yet broken through support, but the price is expected to move up over the next few hours. The price at the time the pattern was found was 3.4735 and it is expected to move to 3.7066.
A Channel Up pattern was identified on XAUUSD at 3359.795, creating an expectation that it may move to the support line at 3314.0931. It may break through that line and continue the bearish trend or it may reverse from that line.
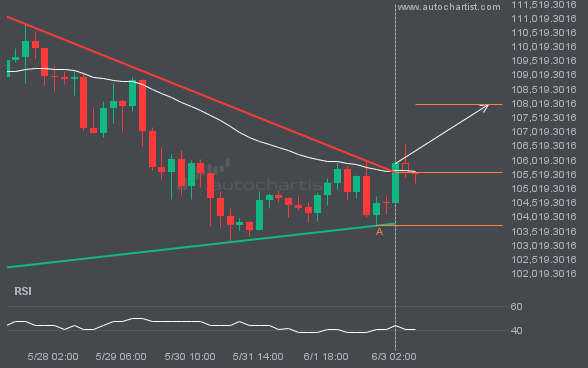
You would be well advised to confirm the breakout that has just occurred – do you believe the move through resistance to be significant? Do you have confirming indicators that the price momentum will continue? If so, look for a target of 107987.2437 but consider reducing the size of your position as the price gets […]
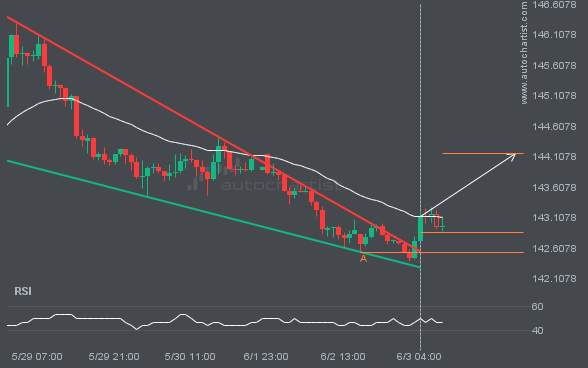
USDJPY has broken through the resistance line which it has tested twice in the past. We have seen it retrace from this line before, so one should wait for confirmation of the breakout before trading. If this new trend persists, a target level of around 144.1523 may materialize within the next 18 hours.
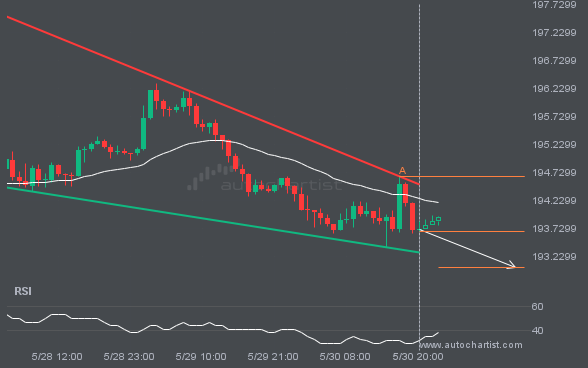
An emerging Falling Wedge has been detected on GBPJPY on the 1 hour chart. There is a possible move towards 193.0367 next few candles. Once reaching resistance it may continue its bearish run or reverse back to current price levels.