Skip to content
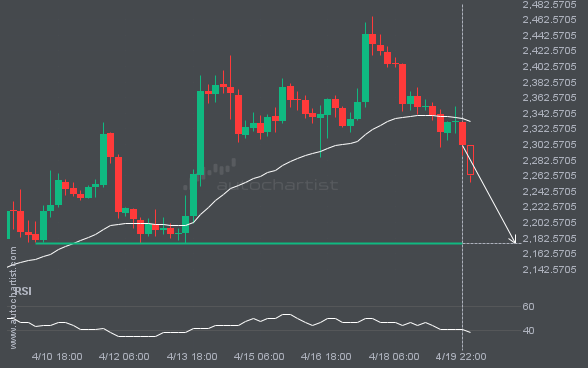
 The movement of ETHUSD towards the 2175.2000 price line is yet another test of a line it has reached numerous times in the past. We can expect this test to occur within the next 3 days, but it is uncertain whether it will result in a breakout through this line or simply rebound to current […]
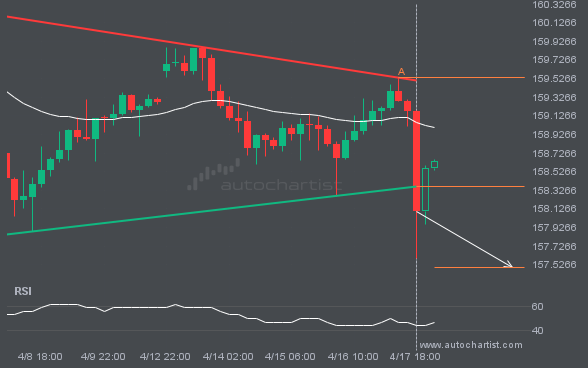
It would be prudent to confirm the breakout that just occurred. Do you consider the move through support significant? Do you have indicators confirming that the price momentum will continue? If so, aim for a target of 157.4991, but consider reducing your position size as the price approaches that target.
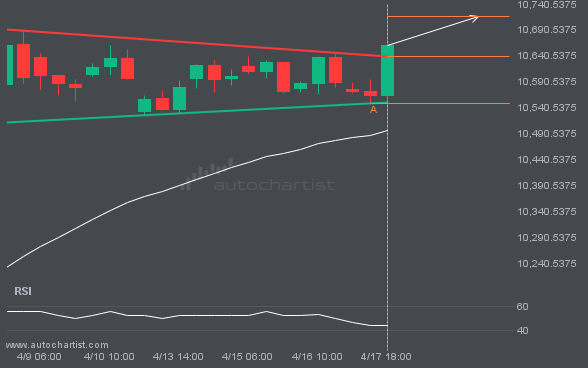
FTSE100 has broken through the resistance line of a Pennant technical chart pattern. Because it has retraced from this line in the past, you should wait for confirmation of the breakout before taking any action. It has touched this line twice in the last 22 days, which suggests a possible target around 10716.3348 within the […]
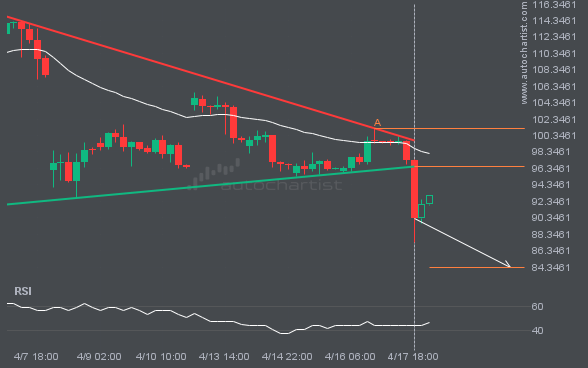
BRN/USD has broken through the support line of a Triangle technical chart pattern. Because it has retraced from this line in the past, you should wait for confirmation of the breakout before taking any action. It has touched this line twice in the last 17 days, suggesting a possible target level around 84.2973 within the […]
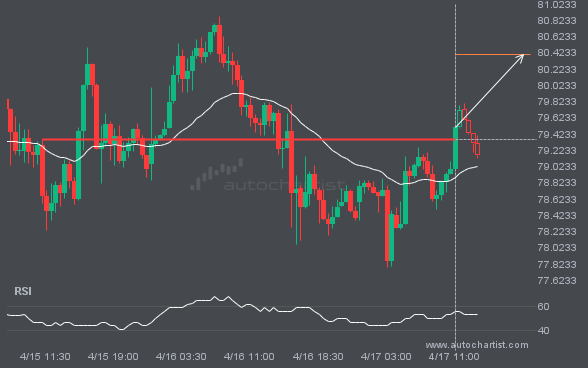
The price of XAGUSD is heading toward 80.4000. Despite the recent breakout through 79.3545, it may struggle to gain momentum to reach the forecast price and could move back in the other direction. This has happened many times in the past, so watch for a possible bounce back.
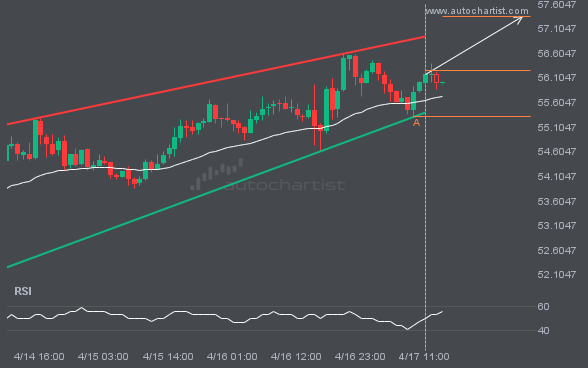
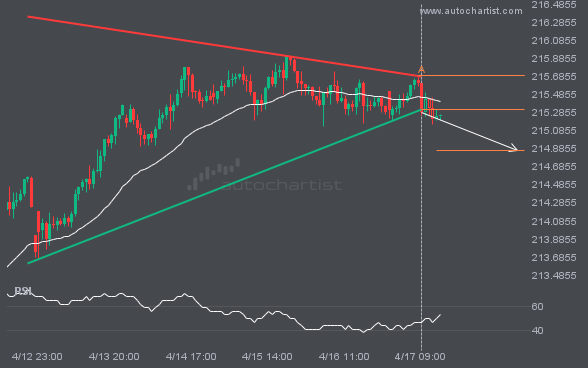
LTCUSD is trapped in a Rising Wedge formation, implying that a breakout is imminent. This is a strong trade setup for both trend and swing traders. It is now approaching a support line that has been tested before. Divergence watchers may be optimistic about a potential breakout, which could mark the start of a new […]