 Skip to content
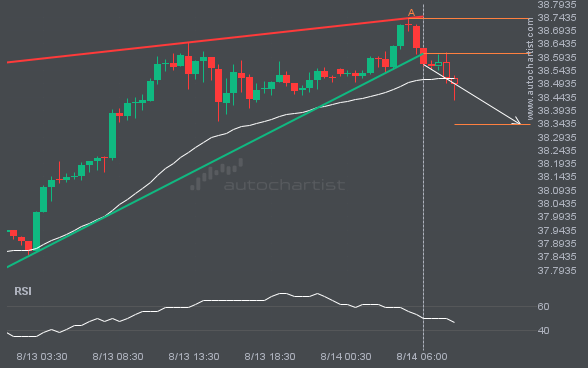
 This trade setup on XAGUSD is formed by a period of consolidation; a period in which the price primarily moves sideways before choosing a new direction for the longer term. Because of the bearish breakout through support, it seems to suggest that we could see the next price move to 38.3412.
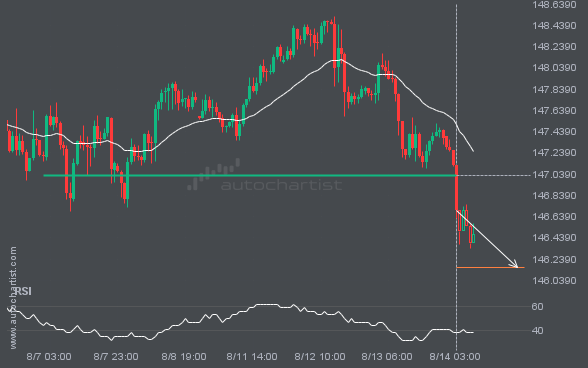
USDJPY has broken through a support line. Because we have seen it retrace from this price in the past, one should wait for confirmation of the breakout before trading. It has touched this line numerous times in the last 8 days and suggests a possible target level to be around 146.1615 within the next 2 […]
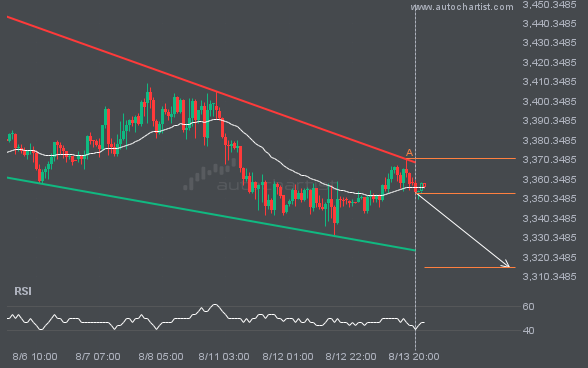
XAUUSD was identified at around 3352.775 having recently rebounded of the resistance on the 1 hour data interval. Ultimately, the price action of the stock has formed a Falling Wedge pattern. This squeeze may increases the chances of a strong breakout. The projected movement will potentially take the price to around the 3314.9774 level.
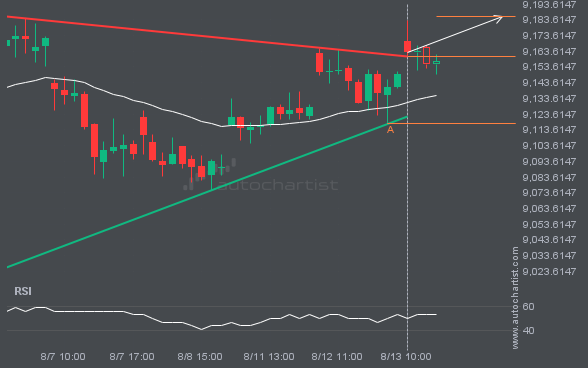
The breakout of FTSE100 through the resistance line of a Triangle could be a sign of the road ahead. If this breakout persists, we may see the price of FTSE100 testing 9185.6390 within the next 9 hours.
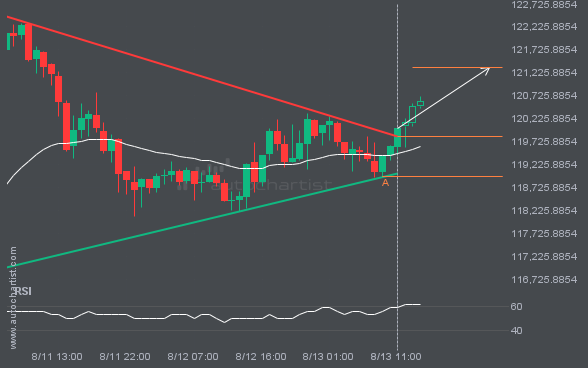
BTCUSD has broken through a resistance line of a Triangle and suggests a possible movement to 121352.5051 within the next 13 hours. It has tested this line in the past, so one should probably wait for a confirmation of this breakout before taking action. If the breakout doesn’t confirm, we could see a retracement back […]
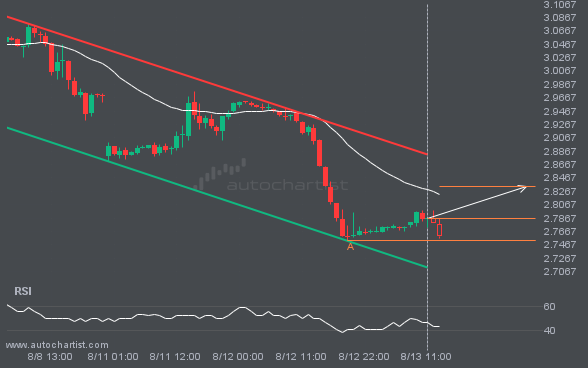
A Channel Down pattern was identified on NGC/USD at 2.7865, creating an expectation that it may move to the resistance line at 2.8340. It may break through that line and continue the bullish trend or it may reverse from that line.
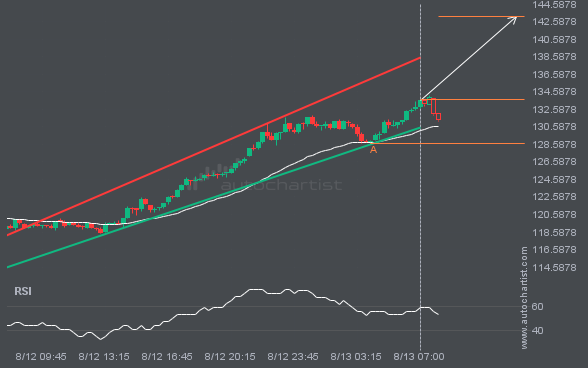
LTCUSD is heading towards the resistance line of a Channel Up. If this movement continues, the price of LTCUSD could test 143.1575 within the next 6 hours. It has tested this line numerous times in the past, so this movement could be short-lived and end up rebounding just like it did in the past.

