Skip to content
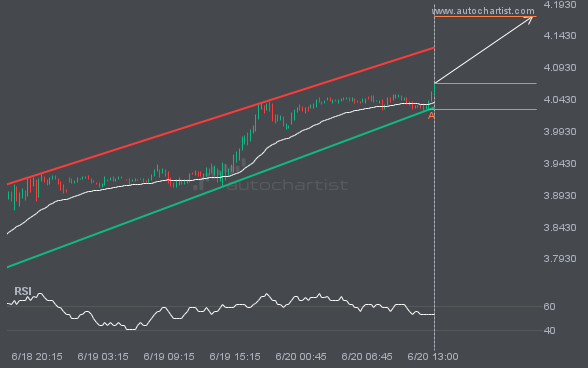
NGC/USD is heading towards the resistance line of a Channel Up. If this movement continues, the price of NGC/USD could test 4.1733 within the next 12 hours. It has tested this line numerous times in the past, so this movement could be short-lived and end up rebounding just like it did in the past.
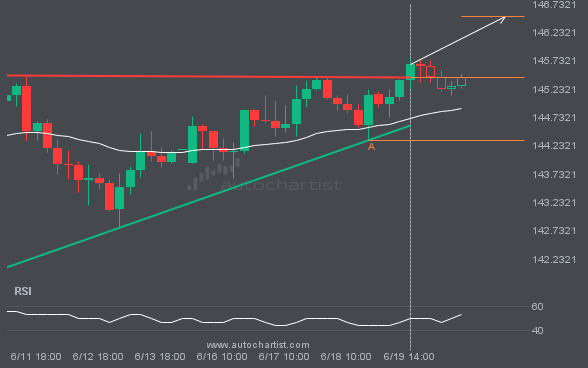
The last 11 4 hour candles on USDJPY formed a Ascending Triangle pattern and broken out through the pattern lines, indicating a possible bullish movement towards the price level of 146.5109.
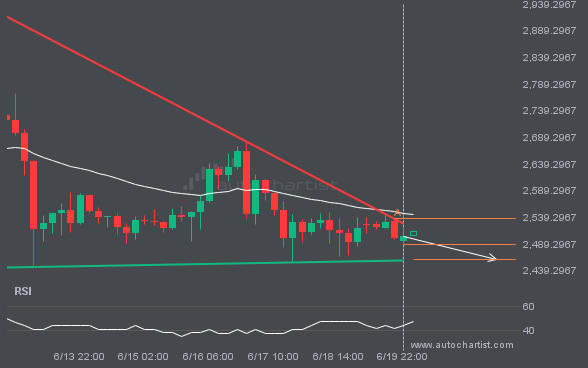
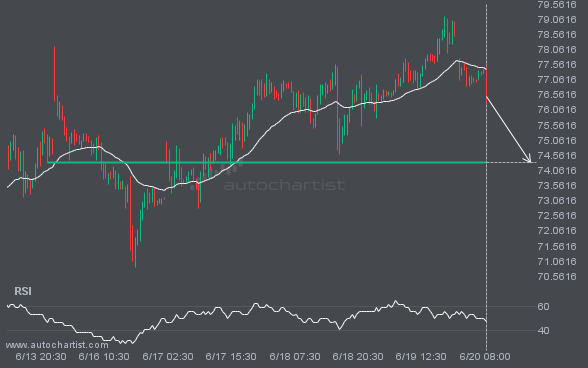
ETHUSD is moving towards a support line. Because we have seen it retrace from this line before, we could see either a break through this line, or a rebound back to current levels. It has touched this line numerous times in the last 9 days and may test it again within the next 2 days.
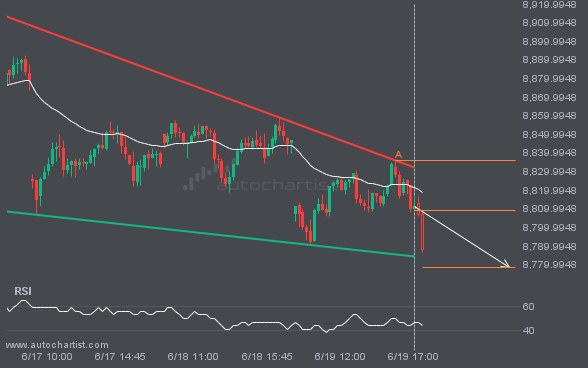
Emerging Falling Wedge pattern in its final wave was identified on the FTSE100 15 Minutes chart. After a strong bearish run, we find FTSE100 heading towards the upper triangle line with a possible resistance at 8778.4935. If the support shows to hold, the Falling Wedge pattern suggests a rebound back towards current levels.
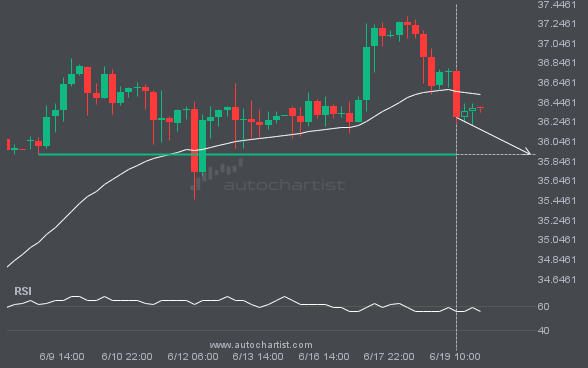
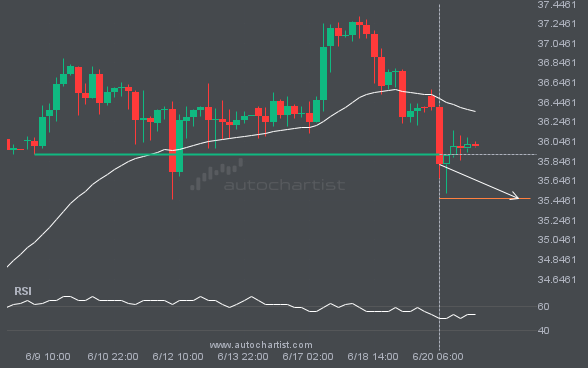
XAGUSD is heading towards a line of 35.9149. If this movement continues, the price of XAGUSD could test 35.9149 within the next 2 days. But don’t be so quick to trade, it has tested this line numerous times in the past, so this movement could be short-lived and end up rebounding.