Skip to content
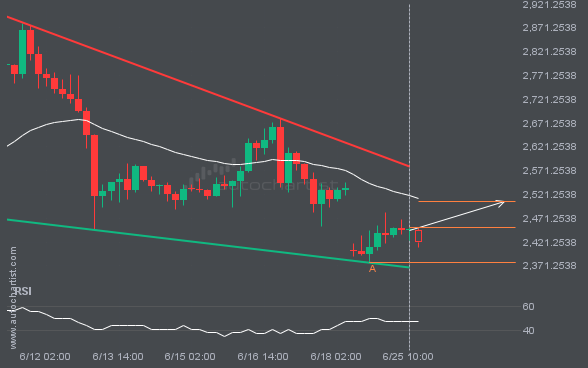
 ETHUSD was identified at around 2452.05 having recently rebounded of the support on the 4 hour data interval. Ultimately, the price action of the stock has formed a Falling Wedge pattern. This squeeze may increases the chances of a strong breakout. The projected movement will potentially take the price to around the 2507.1869 level.
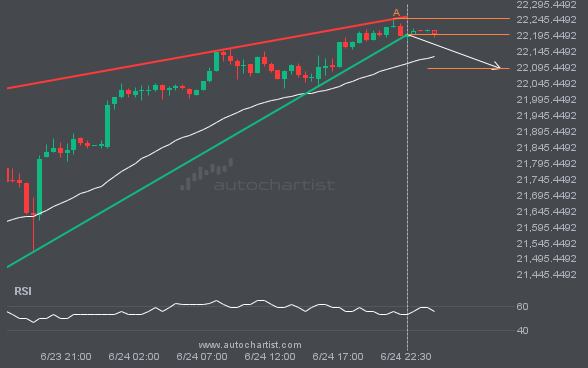
NAS100 has broken through the support line of a Rising Wedge technical chart pattern. Because we have seen it retrace from this line in the past, one should wait for confirmation of the breakout before taking any action. It has touched this line twice in the last 2 days and suggests a possible target level […]
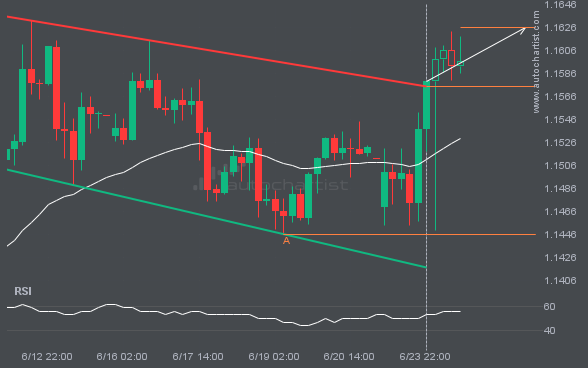
The breakout of EURUSD through the resistance line of a Channel Down could be a sign of the road ahead. If this breakout persists, we may see the price of EURUSD testing 1.1626 within the next 2 days.
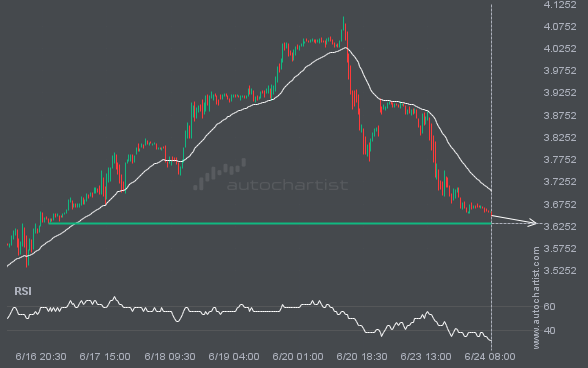
NGC/USD is heading towards a line of 3.6320. If this movement continues, the price of NGC/USD could test 3.6320 within the next 2 days. But don’t be so quick to trade, it has tested this line numerous times in the past, so this movement could be short-lived and end up rebounding.
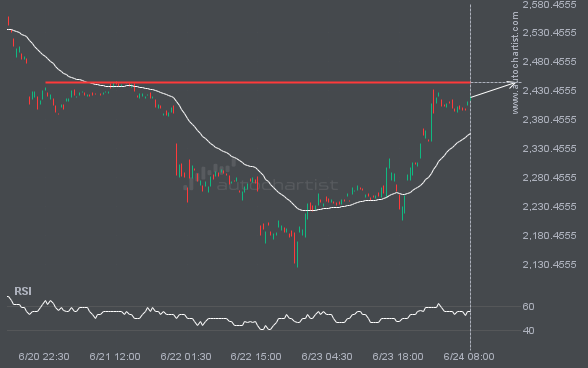
ETHUSD is about to retest a key horizontal resistance level near 2444.8401. It has tested this level 6 times in the recent past and could simply bounce off like it did last time. However, after this many tries, maybe it’s ready to start a new trend.

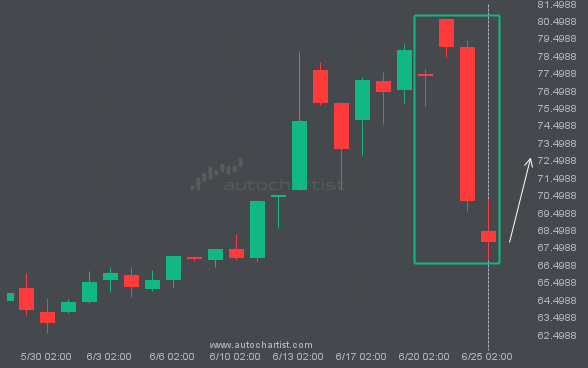
USDJPY is moving towards a key support level at 144.3275. This is a previously tested level for USDJPY. This could be a good trading opportunity, either at the spot price, or after breaching this level.