Daily Top Trade Setups: Advanced Forex, Indices, Commodities, and Stock Analysis
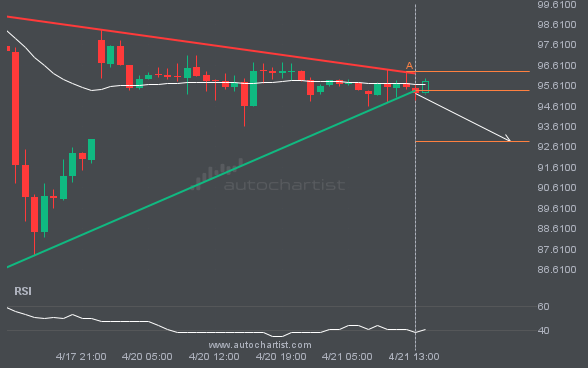
Bulls aim for 92.8832 after BRN/USD triggered a bearish formation on the 1 hour chart.
BRN/USD has broken through the support line of a Triangle technical chart pattern. Because it has retraced from this line in the past, you should wait for confirmation of the breakout before taking any action. It has touched this line twice in the last 5 days, which suggests a possible target around 92.8832 within the […]
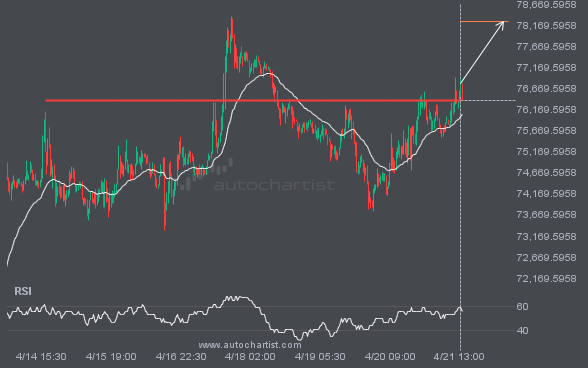
A breach of 76393.5781 could signal the start of a bullish trend in BTCUSD.
BTCUSD has broken through a level at 76393.5781, suggesting a possible move to 78263.2656 within the next 2 days. It has tested this level numerous times in the past, so you should wait for confirmation of this breakout before taking any action. If the breakout does not confirm, we could see a retracement back to […]
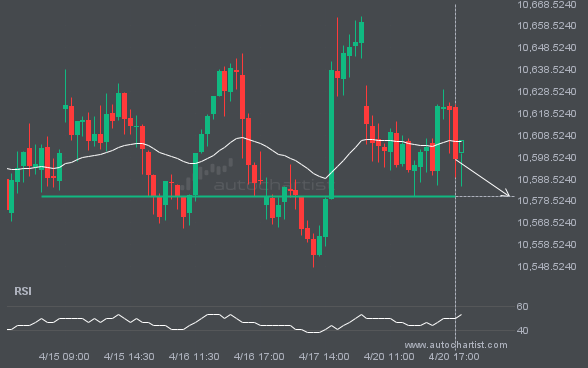
FTSE100 is heading toward a price it has tested 3 times recently.
FTSE100 is moving toward a level at 10580.7305, which it has tested many times before. We have seen it retrace from this level before, so at this stage it isn’t clear whether it will break through this price or rebound again. If FTSE100 continues on its current trajectory, we may see it move toward 10580.7305 […]
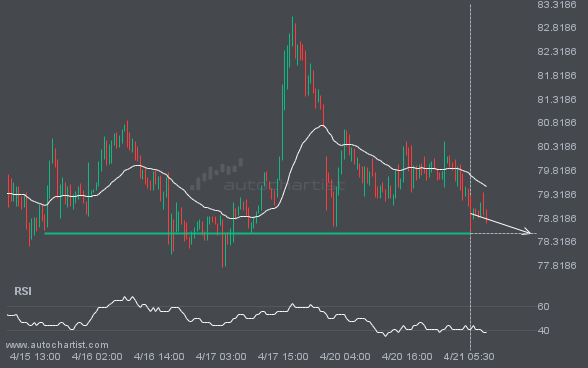
If you’re long on XAGUSD, be aware of the rapidly approaching level at 78.4952.
A strong support level has been identified at 78.4952 on the 30 Minutes XAGUSD chart. XAGUSD is likely to test this level soon.
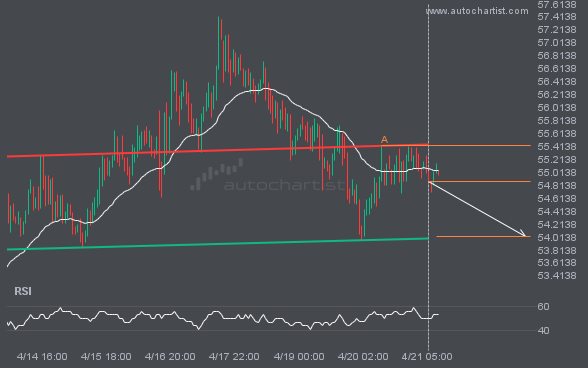
LTCUSD is approaching a support line of a Head and Shoulders. It has touched this line numerous times in the last 8 days.
A Head and Shoulders pattern was identified for LTCUSD at 54.87, suggesting it may move toward the support line at 54.0245. It may break through that line and continue the bearish trend, or reverse from it.
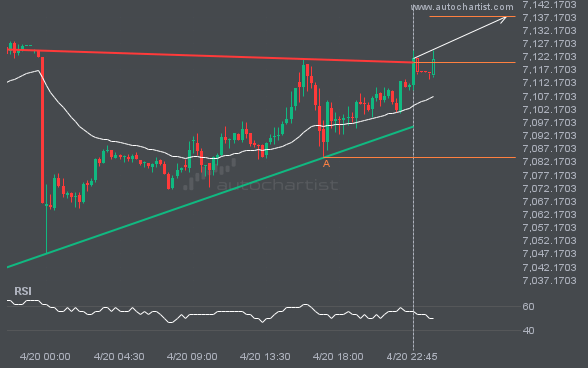
Bulls aim for 7137.4023 after S&P500 triggered a bullish formation on the 15 Minutes chart.
S&P500 has broken through the resistance line of a Ascending Triangle technical chart pattern. Because it has retraced from this line in the past, you should wait for confirmation of the breakout before taking any action. It has touched this line twice in the last 4 days, which suggests a possible target around 7137.4023 within […]
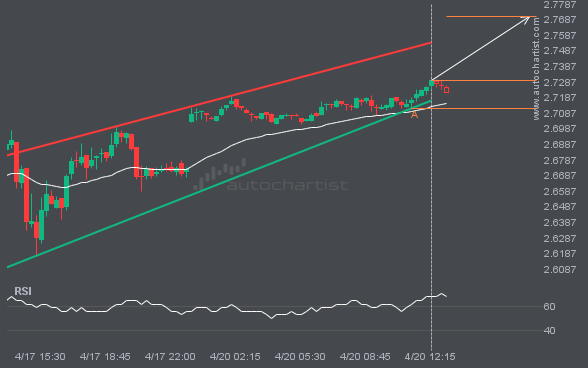
A Pennant has formed, and NGC/USD is approaching support. Should we expect a breakout and the start of a new trend, or a reversal?
NGC/USD is heading toward the resistance line in a Pennant pattern. If this move continues, the price of NGC/USD could test 2.7707 within the next 6 hours. It has tested this line many times before, so the move could be short-lived and may rebound as it has before.
Latest company news, corporate actions and partnership announcements
Interesting trading articles, ideas, and thought leadership
Ask your broker today or sign up for a demo from the Technical Analysis page.