 Skip to content
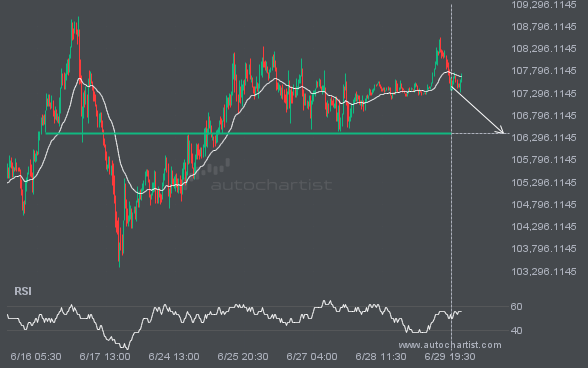
 BTCUSD is moving towards a support line. Because we have seen it retrace from this level in the past, we could see either a break through this line, or a rebound back to current levels. It has touched this line numerous times in the last 14 days and may test it again within the next […]
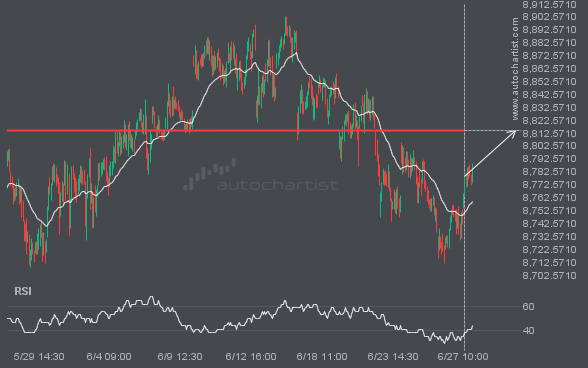
FTSE100 is heading towards 8814.3701 and could reach this point within the next 2 days. It has tested this line numerous times in the past, and this time could be no different, ending in a rebound instead of a breakout. If the breakout doesn’t happen, we could see a retracement back down to current levels.
XAUUSD is moving towards a support line. Because we have seen it retrace from this line before, we could see either a break through this line, or a rebound back to current levels. It has touched this line numerous times in the last 10 days and may test it again within the next 2 days.
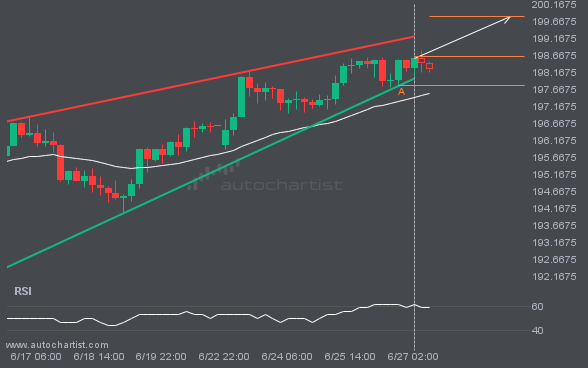
GBPJPY is moving towards a resistance line. Because we have seen it retrace from this line before, we could see either a break through this line, or a rebound back to current levels. It has touched this line numerous times in the last 15 days and may test it again within the next 3 days.
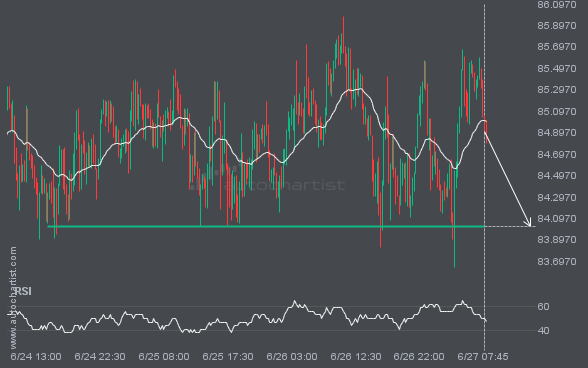
LTCUSD is moving towards a key support level at 84.0200. This is a previously tested level for LTCUSD. This could be a good trading opportunity, either at the spot price, or after breaching this level.
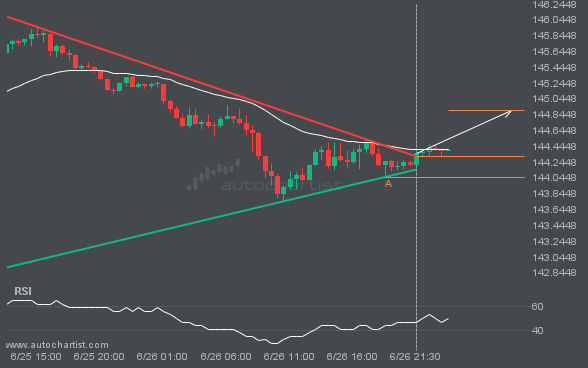
USDJPY has broken through a resistance line. It has touched this line at least twice in the last 2 days. This breakout may indicate a potential move to 144.9037 within the next 7 hours. Because we have seen it retrace from this position in the past, one should wait for confirmation of the breakout before […]
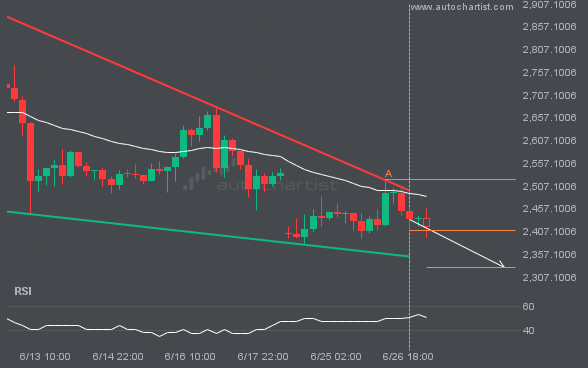
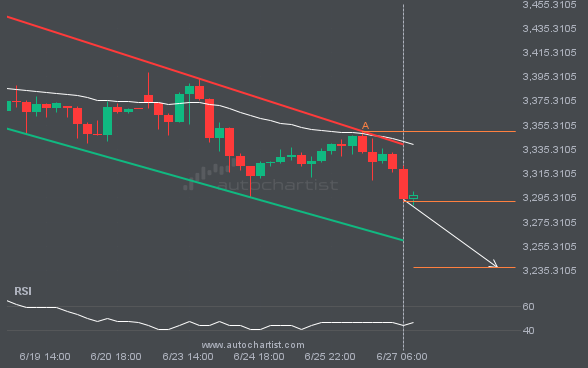
Emerging Falling Wedge pattern in its final wave was identified on the ETHUSD 4 hour chart. After a strong bearish run, we find ETHUSD heading towards the upper triangle line with a possible resistance at 2328.5380. If the support shows to hold, the Falling Wedge pattern suggests a rebound back towards current levels.

