 Skip to content
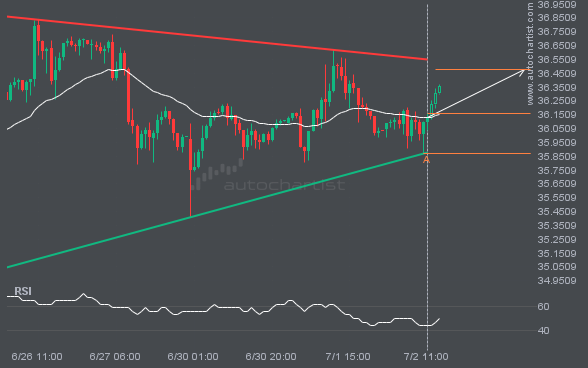
 XAGUSD was identified at around 36.1631 having recently rebounded of the support on the 1 hour data interval. Ultimately, the price action of the stock has formed a Triangle pattern. This squeeze may increases the chances of a strong breakout. The projected movement will potentially take the price to around the 36.4790 level.
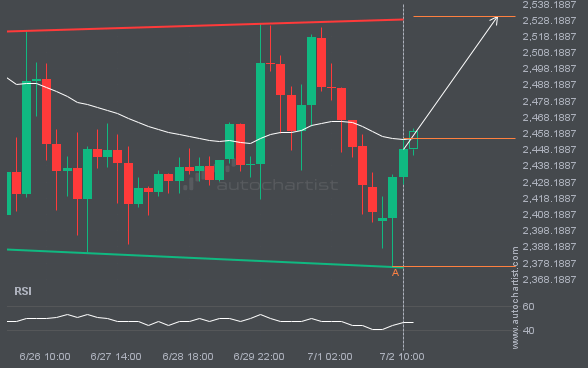
Emerging Rectangle detected on ETHUSD – the pattern is an emerging one and has not yet broken through support, but the price is expected to move up over the next few hours. The price at the time the pattern was found was 2454.85 and it is expected to move to 2530.4388.
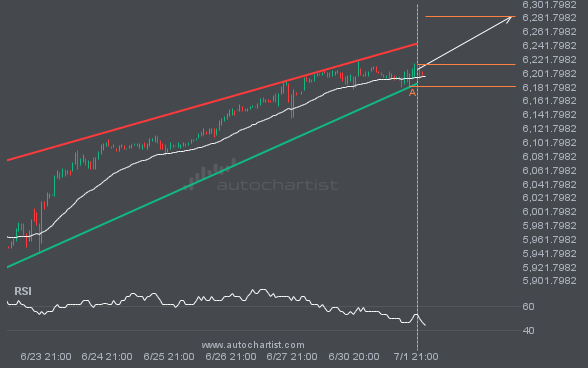
The movement of S&P500 towards the resistance line of a Rising Wedge is yet another test of the line it reached numerous times in the past. This line test could happen in the next 2 days, but it is uncertain whether it will result in a breakout through this line, or simply rebound back to […]
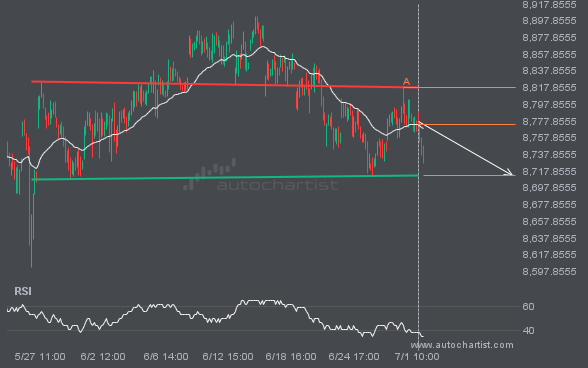
FTSE100 is heading towards the support line of a Head and Shoulders and could reach this point within the next 3 days. It has tested this line numerous times in the past, and this time could be no different from the past, ending in a rebound instead of a breakout. If the breakout doesn’t happen, […]
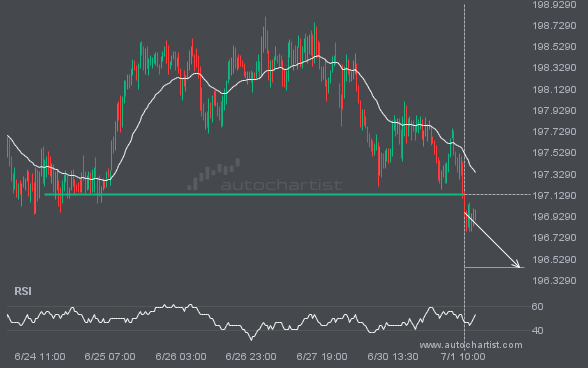
GBPJPY is once again retesting a key horizontal support level at 197.1385. It has tested this level 4 times in the recent past and could simply bounce off like it did last time. However, after this many tries, maybe it’s ready to start a new trend.
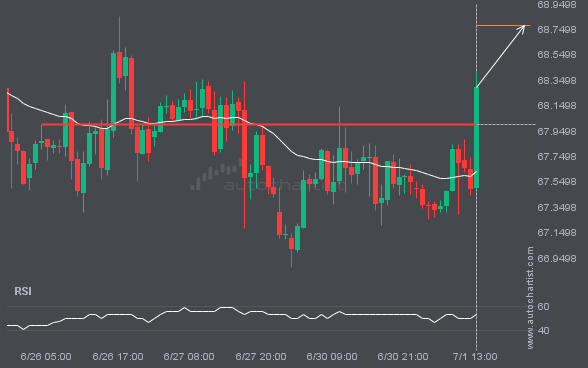
The price of BRN/USD in heading in the direction of 68.7792. Despite the recent breakout through 68.0015 it is possible that it will struggle to gain momentum to the forecast price and move back in the other direction. This has happened many times in the past so watch for a possible bounce back.

The price of NGC/USD in heading back to the support area. It is possible that it will struggle to break through it and move back in the other direction. The price may eventually break through, but typically the price retreats from the level a number of times before doing so.

