 Skip to content
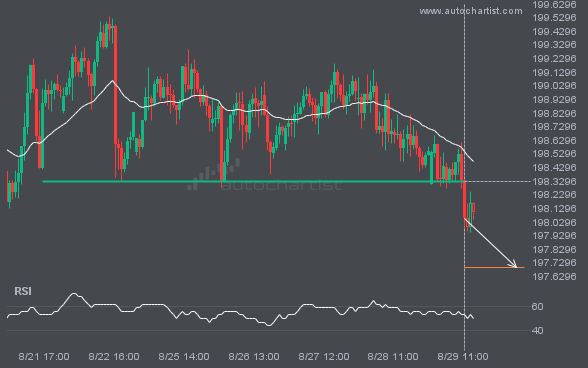
 GBPJPY has broken through a support line. It has touched this line numerous times in the last 8 days. This breakout shows a potential move to 197.6960 within the next 2 days. Because we have seen it retrace from this level in the past, one should wait for confirmation of the breakout.
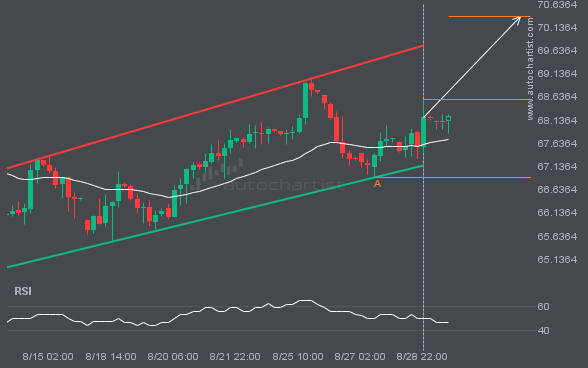
BRN/USD is trapped in a Channel Up formation, implying that a breakout is Imminent. This is a great trade-setup for both trend and swing traders. It is now approaching a support line that has been tested in the past. Divergence opportunists may be very optimistic about a possible breakout and this may be the start […]
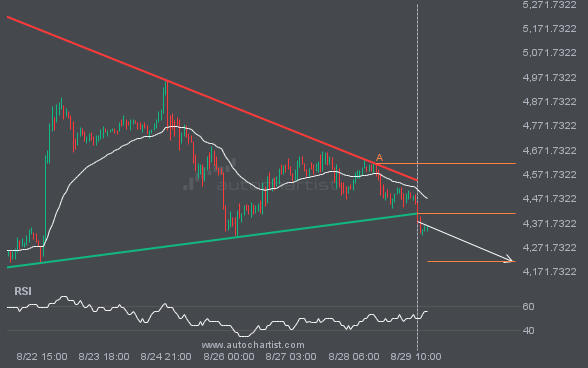
ETHUSD has broken through a support line. It has touched this line at least twice in the last 9 days. This breakout may indicate a potential move to 4212.5125 within the next 3 days. Because we have seen it retrace from this position in the past, one should wait for confirmation of the breakout before […]
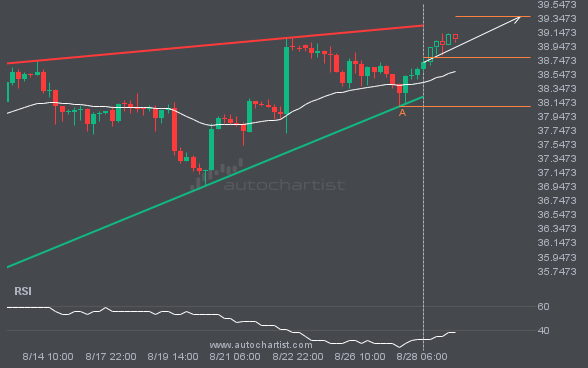
XAGUSD is heading towards the resistance line of a Rising Wedge. If this movement continues, the price of XAGUSD could test 39.3688 within the next 3 days. It has tested this line numerous times in the past, so this movement could be short-lived and end up rebounding just like it did in the past.
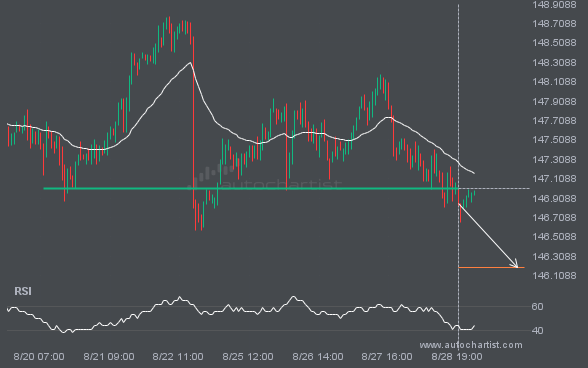
The breakout of USDJPY through the 147.0125 price line is a breach of an important psychological price that is has tested numerous in the past. If this breakout persists, USDJPY could test 146.1939 within the next 2 days. One should always be cautious before placing a trade, wait for confirmation of the breakout.
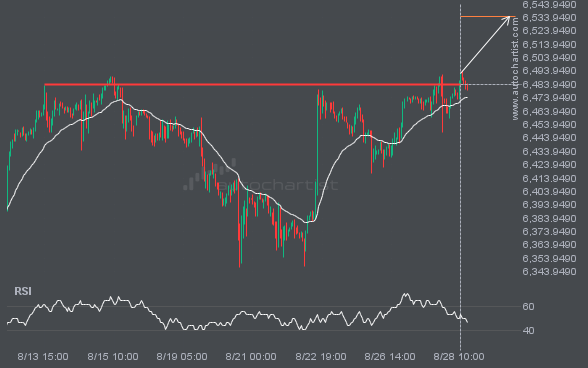
S&P500 has broken through a resistance line. It has touched this line numerous times in the last 15 days. This breakout shows a potential move to 6534.5781 within the next 3 days. Because we have seen it retrace from this level in the past, one should wait for confirmation of the breakout.
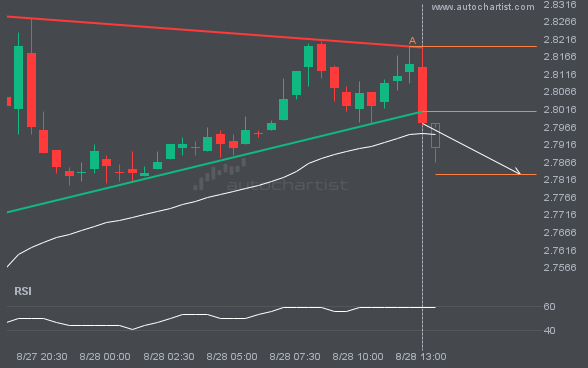
NGC/USD has broken through a support line of a Triangle chart pattern. If this breakout holds true, we may see the price of NGC/USD testing 2.7832 within the next 5 hours. But don’t be so quick to trade, it has tested this line in the past, so you should confirm the breakout before taking any […]

