Skip to content
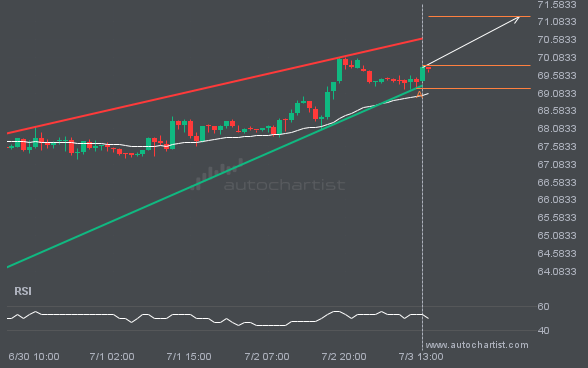
 Emerging Rising Wedge detected on BRN/USD – the pattern is an emerging one and has not yet broken through support, but the price is expected to move up over the next few hours. The price at the time the pattern was found was 69.843 and it is expected to move to 71.2309.
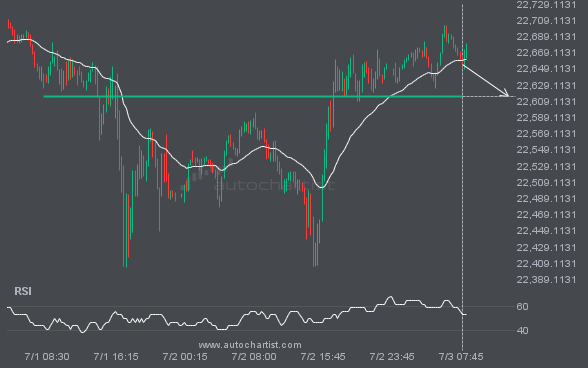
NAS100 is heading towards 22614.4590 and could reach this point within the next 11 hours. It has tested this line numerous times in the past, and this time could be no different, ending in a rebound instead of a breakout. If the breakout doesn’t happen, we could see a retracement back down to current levels.
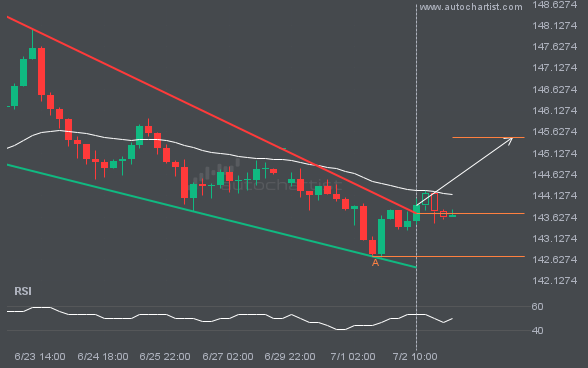
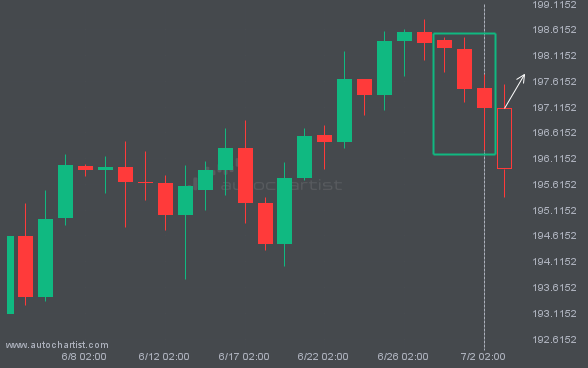
USDJPY has broken through the resistance line of a Falling Wedge technical chart pattern. Because we have seen it retrace from this line in the past, one should wait for confirmation of the breakout before taking any action. It has touched this line twice in the last 20 days and suggests a possible target level […]
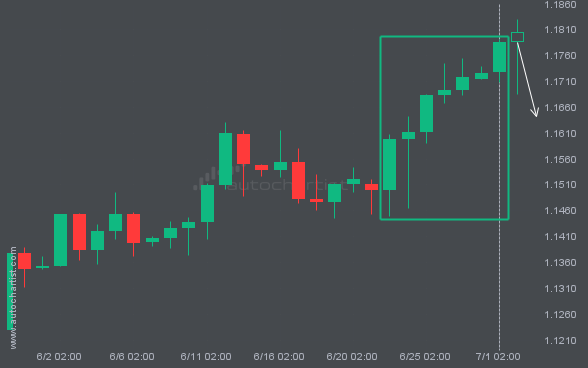
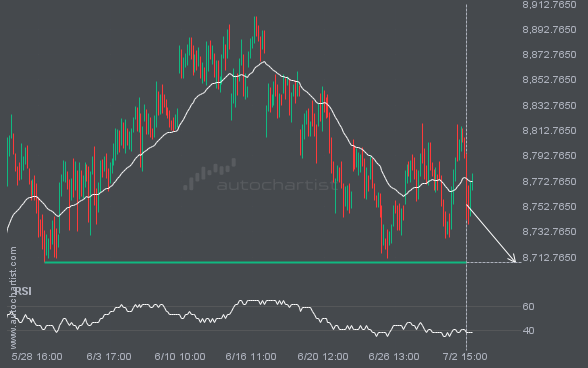
EURUSD has experienced an unusual quantity of bullish candles on the Daily timeframe. This is in the 0.949999988079071 percentile of movements and so we could see a slight pullback over the next few candles.