Skip to content
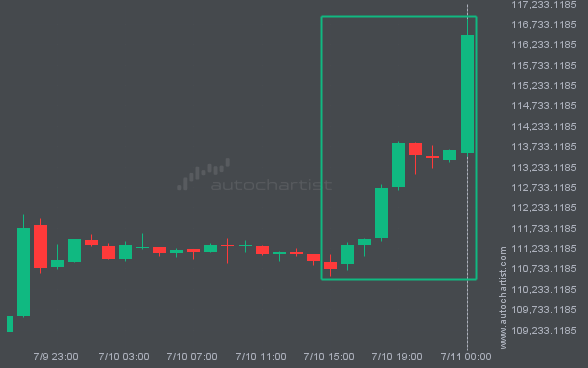
 Emerging Channel Up pattern in its final wave was identified on the LTCUSD 30 Minutes chart. After a strong bullish run, we find LTCUSD heading towards the upper triangle line with a possible resistance at 98.8800. If the resistance shows to hold, the Channel Up pattern suggests a rebound back towards current levels.
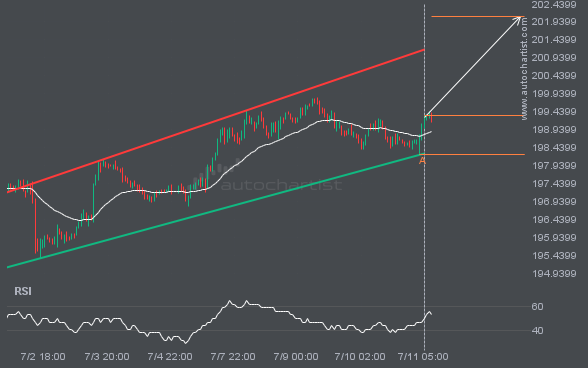
GBPJPY is moving towards a resistance line which it has tested numerous times in the past. We have seen it retrace from this line before, so at this stage it isn’t clear whether it will breach this line or rebound as it did before. If GBPJPY continues in its current trajectory, we could see it […]
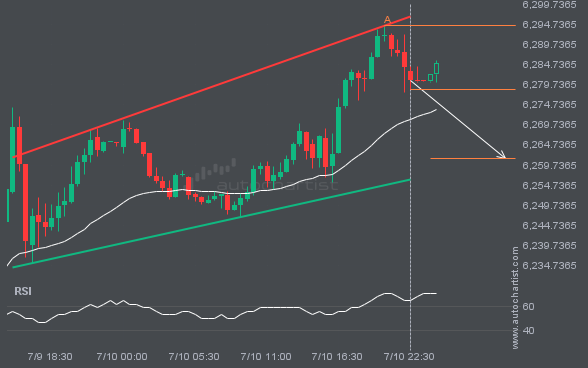
A Channel Up pattern was identified on S&P500 at 6278.43, creating an expectation that it may move to the support line at 6261.2861. It may break through that line and continue the bearish trend or it may reverse from that line.
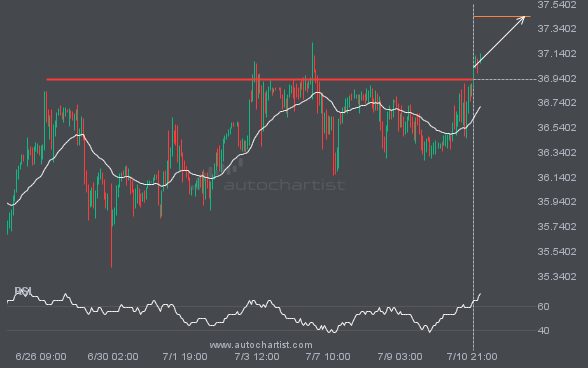
XAGUSD has broken through 36.9301 which it has tested numerous times in the past. We have seen it retrace from this price in the past. If this new trend persists, XAGUSD may be heading towards 37.4388 within the next 3 days.
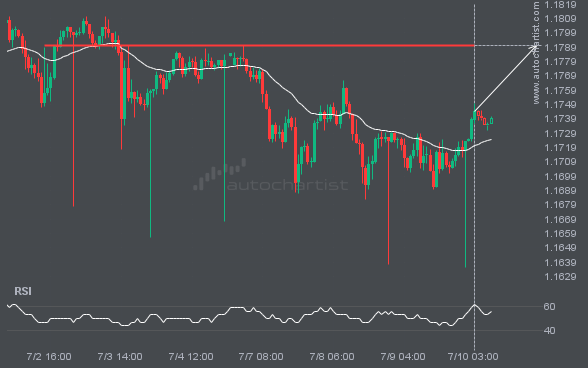
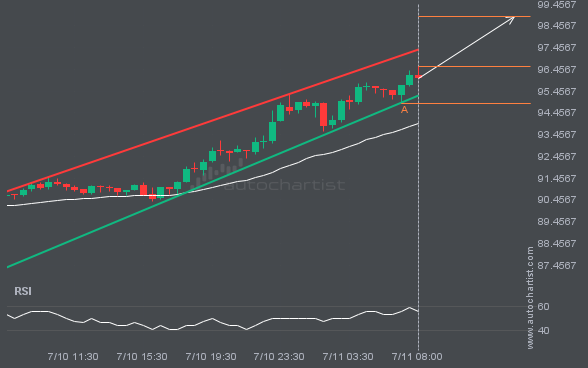
EURUSD is moving towards a key resistance level at 1.1790. EURUSD has previously tested this level 4 times and on each occasion it has bounced back off this level. Is this finally the time it will break through?
The movement of NAS100 towards the resistance line of a Channel Up is yet another test of the line it reached numerous times in the past. This line test could happen in the next 3 days, but it is uncertain whether it will result in a breakout through this line, or simply rebound back to […]