Skip to content
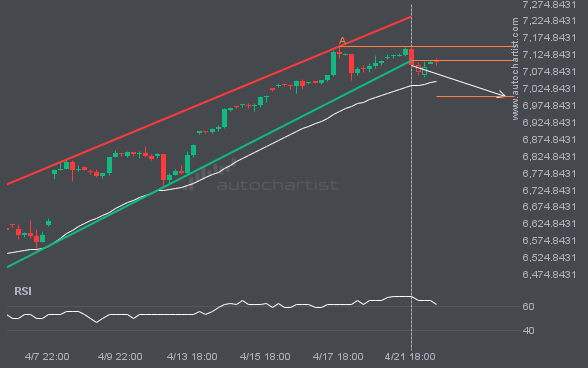
S&P500 has broken through a support line of the Channel Up chart pattern. If this breakout holds, we may see the price of S&P500 test 7000.6465 within the next 3 days. But don’t rush to trade. It has tested this line before, so confirm the breakout before taking any action.
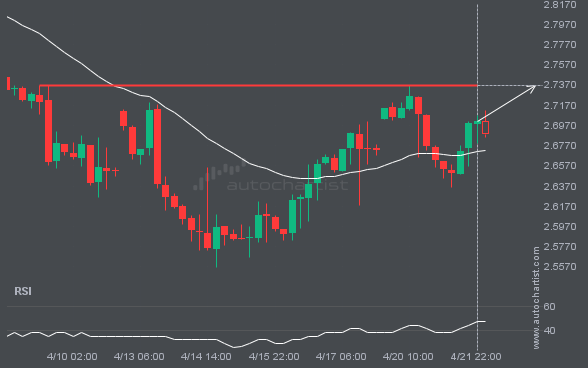
NGC/USD is moving toward a resistance line. Because it has retraced from this level in the past, we may see either a breakout through this line or a rebound to current levels. It has touched this line multiple times over the last 13 days and may test it again within the next 2 days.
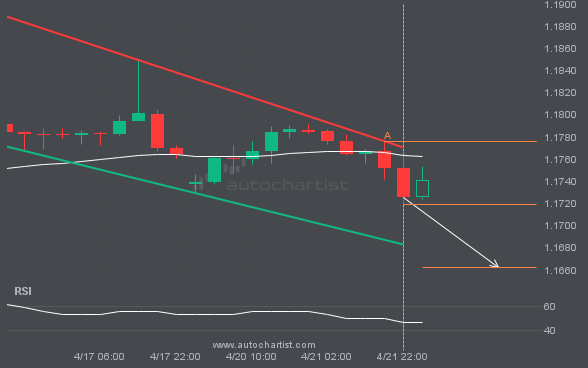
EURUSD is trapped in a Channel Down formation, implying that a breakout is imminent. This is a strong trade setup for both trend and swing traders. It is now approaching a resistance line that has been tested before. Divergence watchers may be optimistic about a potential breakout, which could mark the start of a new […]
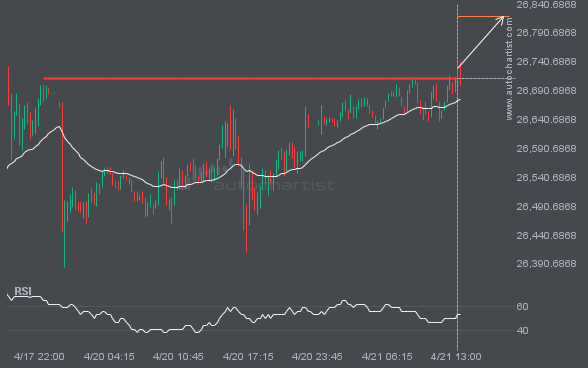
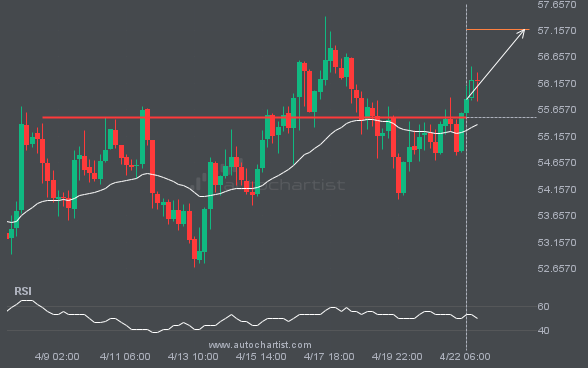
NAS100 has broken through a resistance line. Since it has previously retraced from this price, wait for confirmation of the breakout before trading. It has touched this line several times over the past 4 days. This suggests a possible target around 26818.9688 within the next 9 hours.
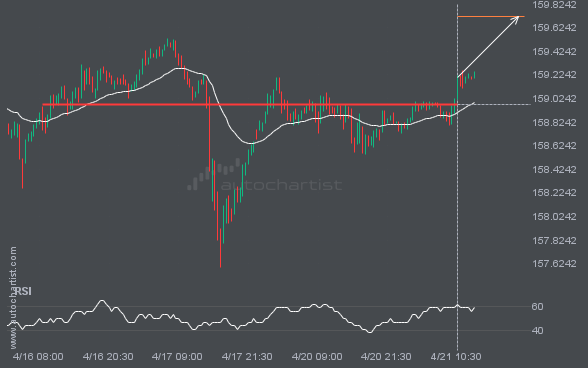
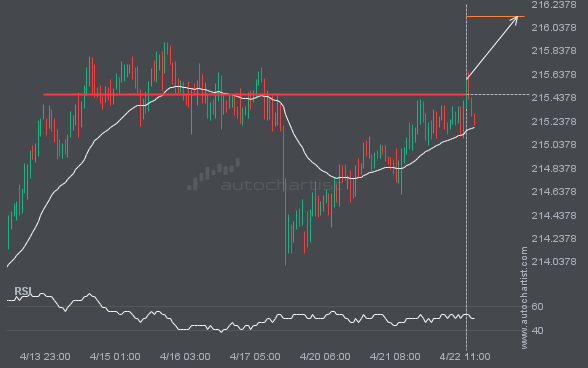
The breakout of USDJPY through the 158.9740 price line is a breach of an important psychological price level that it has tested numerous times in the past. If this breakout persists, USDJPY could test 159.7179 within the next 15 hours. One should always be cautious before placing a trade and wait for confirmation of the […]