Skip to content
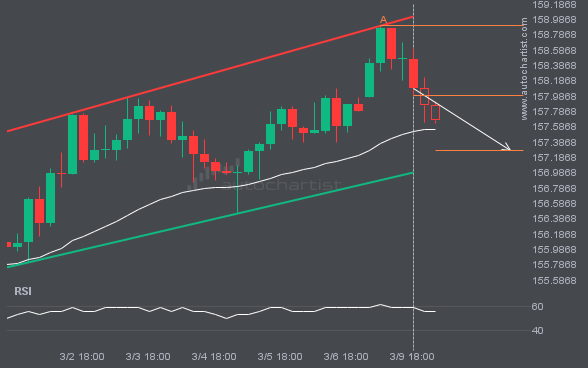
 A Channel Up pattern was identified for USDJPY at 157.997, suggesting it may move toward the support line at 157.2817. It may break through that line and continue the bearish trend, or reverse from it.
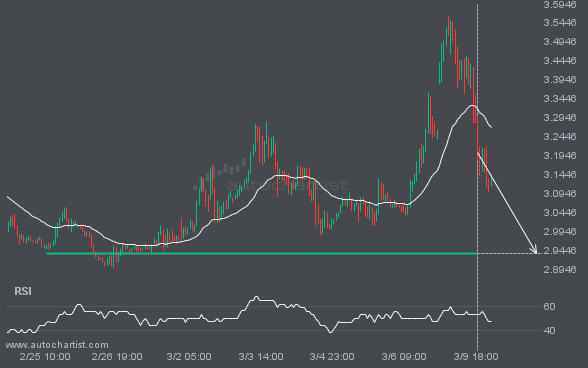
The movement of NGC/USD towards the 2.9370 price line is yet another test of a line it has reached numerous times in the past. We can expect this test to occur within the next 2 days, but it is uncertain whether it will result in a breakout through this line or simply rebound to current […]
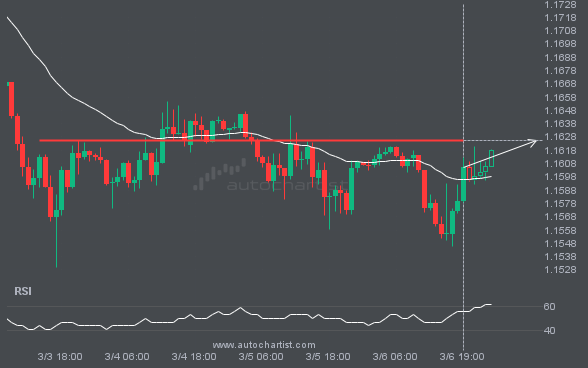
The price of EURUSD is heading back toward the resistance area. It may struggle to break through and could reverse direction. The price may eventually break through, but it typically retreats from the level several times before doing so.