 Skip to content
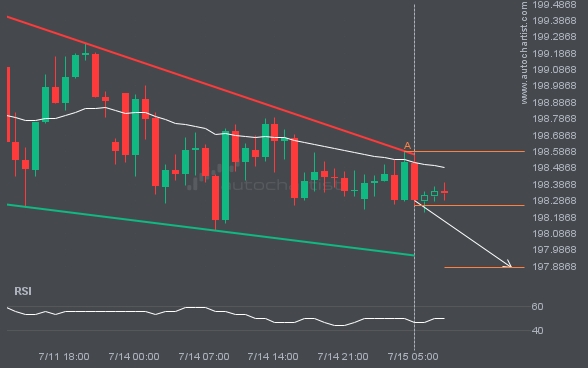
 GBPJPY is trapped in a Falling Wedge formation, implying that a breakout is Imminent. This is a great trade-setup for both trend and swing traders. It is now approaching a resistance line that has been tested in the past. Divergence opportunists may be very optimistic about a possible breakout and this may be the start […]
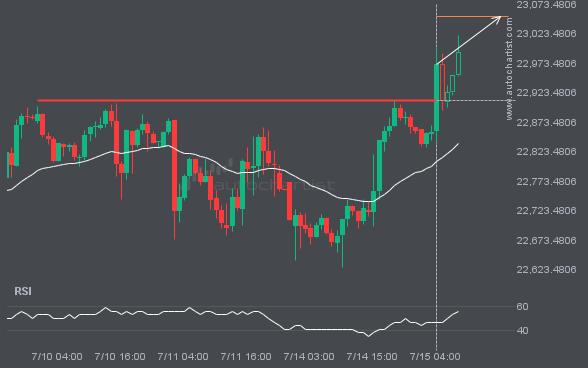
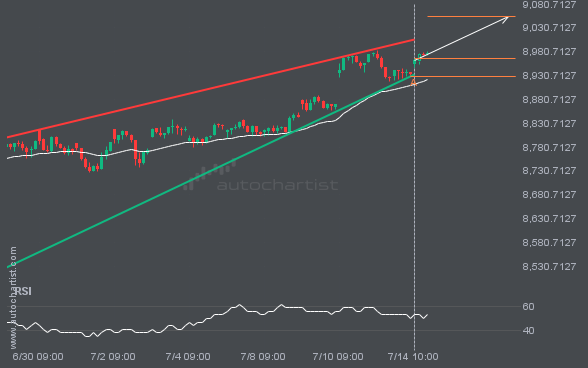
The price of NAS100 in heading in the direction of 23052.2461. Despite the recent breakout through 22909.3438 it is possible that it will struggle to gain momentum to the forecast price and move back in the other direction. This has happened many times in the past so watch for a possible bounce back.
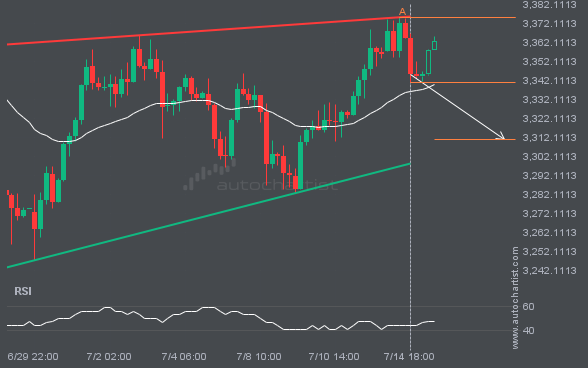
XAUUSD is heading towards the support line of a Rising Wedge. If this movement continues, the price of XAUUSD could test 3310.8299 within the next 3 days. It has tested this line numerous times in the past, so this movement could be short-lived and end up rebounding just like it did in the past.
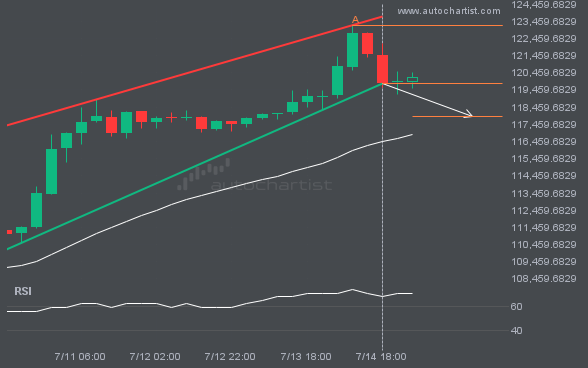
BTCUSD moved through the support line of a Rising Wedge at 119849.688 on the 4 hour chart. This line has been tested a number of times in the past and this breakout could mean an upcoming change from the current trend. It may continue in its current direction toward 117917.6171.
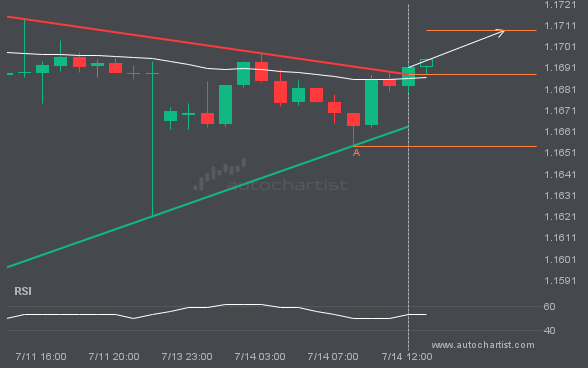
Triangle pattern identified on EURUSD has broken through a resistance level with the price momentum continuing to move in an upward direction. A solid trading opportunity continues with the price expected to reach 1.1709 in the next 5.
FTSE100 is moving towards a resistance line. Because we have seen it retrace from this line before, we could see either a break through this line, or a rebound back to current levels. It has touched this line numerous times in the last 19 days and may test it again within the next 2 days.
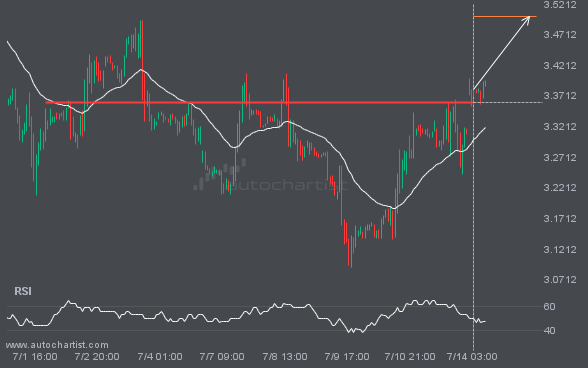
NGC/USD has broken through a resistance line. It has touched this line numerous times in the last 13 days. This breakout shows a potential move to 3.5007 within the next 2 days. Because we have seen it retrace from this level in the past, one should wait for confirmation of the breakout.

