 Skip to content
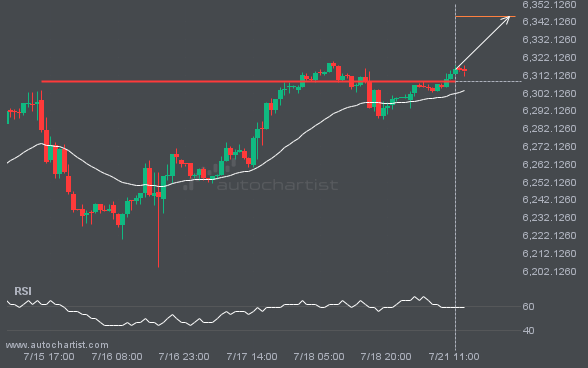
 S&P500 has broken through a line of 6308.4600. If this breakout holds true, we could see the price of S&P500 heading towards 6345.0781 within the next 20 hours. But don’t be so quick to trade, it has tested this line numerous times in the past, so you should probably confirm the breakout before placing any […]
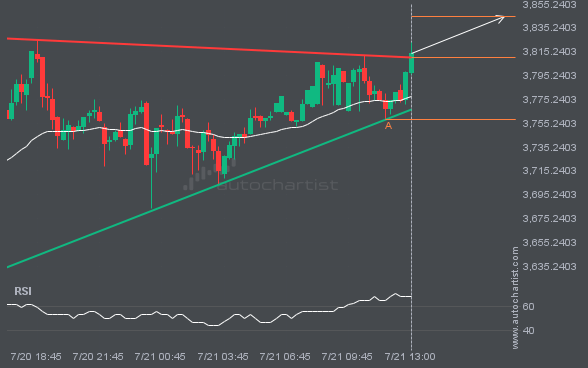
ETHUSD has broken through a resistance line of a Triangle and suggests a possible movement to 3844.7181 within the next 5 hours. It has tested this line in the past, so one should probably wait for a confirmation of this breakout before taking action. If the breakout doesn’t confirm, we could see a retracement back […]
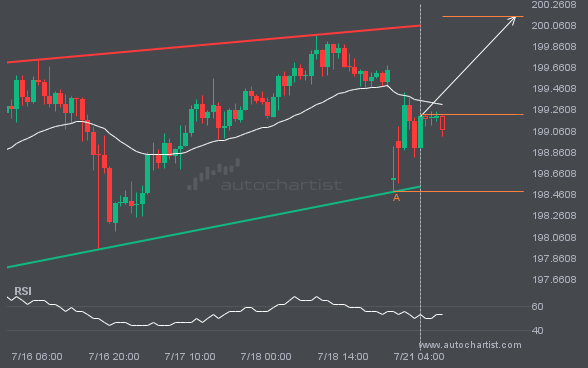
GBPJPY is moving towards a resistance line which it has tested numerous times in the past. We have seen it retrace from this line before, so at this stage it isn’t clear whether it will breach this line or rebound as it did before. If GBPJPY continues in its current trajectory, we could see it […]
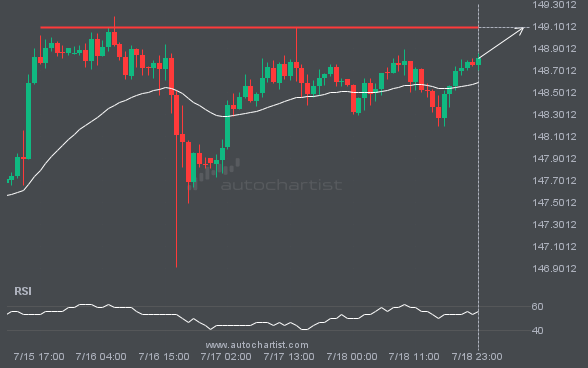
USDJPY is moving towards a resistance line. Because we have seen it retrace from this level in the past, we could see either a break through this line, or a rebound back to current levels. It has touched this line numerous times in the last 4 days and may test it again within the next […]
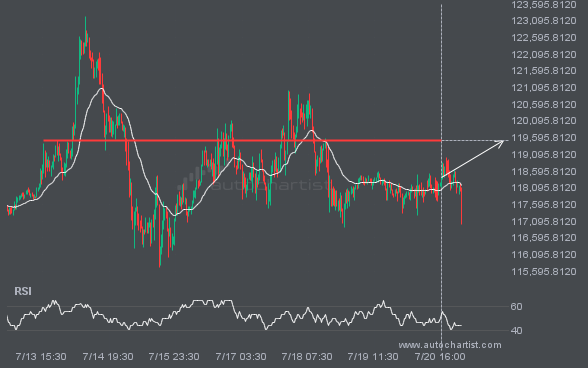
BTCUSD is heading towards 119503.5625 and could reach this point within the next 2 days. It has tested this line numerous times in the past, and this time could be no different, ending in a rebound instead of a breakout. If the breakout doesn’t happen, we could see a retracement back down to current levels.
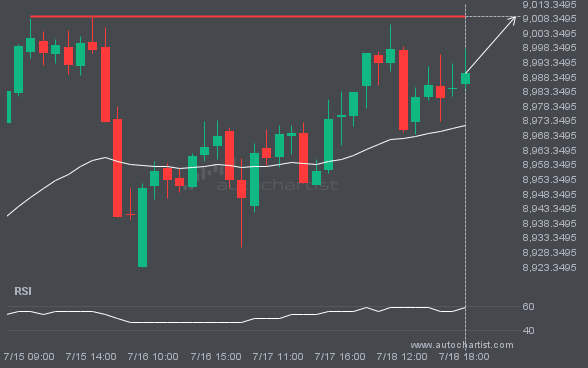
FTSE100 is moving towards a key resistance level at 9009.0596. This is a previously tested level for FTSE100. This could be a good trading opportunity, either at the spot price, or after breaching this level.
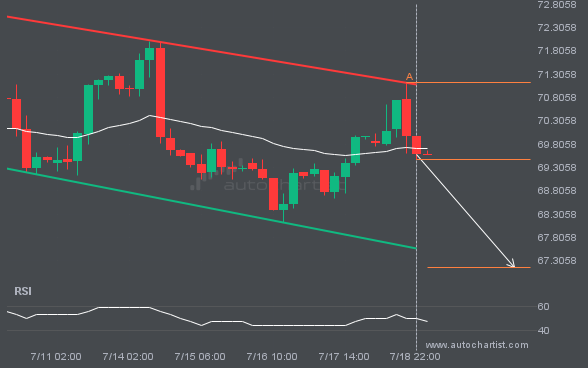
The movement of BRN/USD towards the support line of a Channel Down is yet another test of the line it reached numerous times in the past. This line test could happen in the next 2 days, but it is uncertain whether it will result in a breakout through this line, or simply rebound back to […]

