 Skip to content
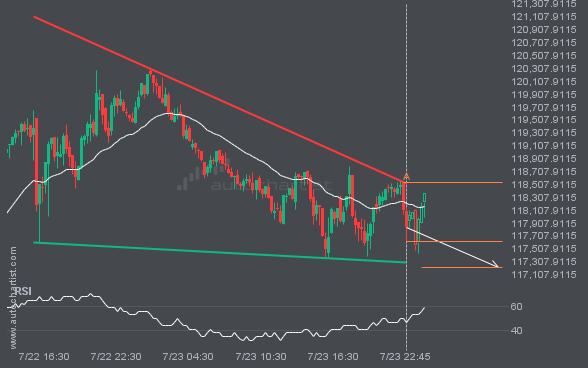
 Emerging Falling Wedge detected on BTCUSD – the pattern is an emerging one and has not yet broken through resistance, but the price is expected to move up over the next few hours. The price at the time the pattern was found was 117618.95 and it is expected to move to 117219.2098.
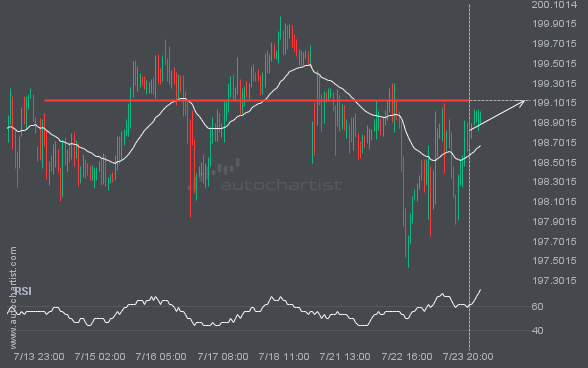
GBPJPY is moving towards a line of 199.1235 which it has tested numerous times in the past. We have seen it retrace from this position in the past, so at this stage it isn’t clear whether it will breach this price or rebound as it did before. If GBPJPY continues in its current trajectory, we […]
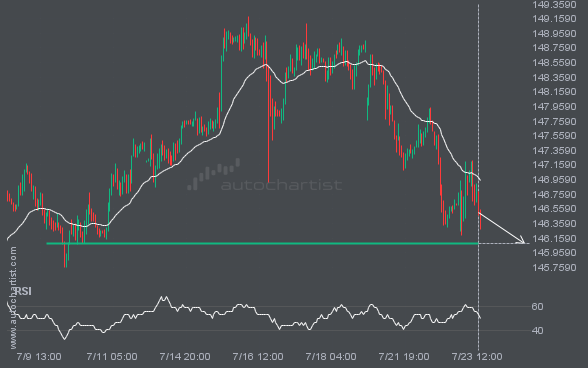
USDJPY is heading towards 146.0845 and could reach this point within the next 3 days. It has tested this line numerous times in the past, and this time could be no different, ending in a rebound instead of a breakout. If the breakout doesn’t happen, we could see a retracement back down to current levels.
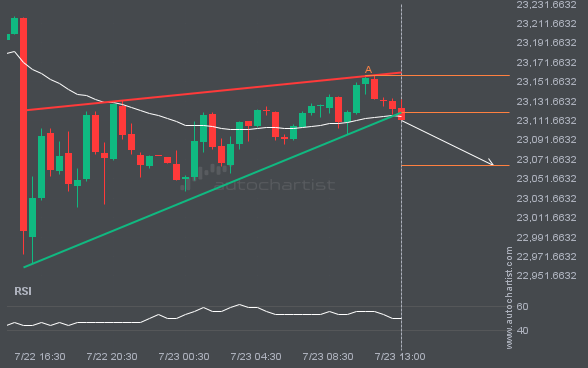
This trade setup on NAS100 is formed by a period of consolidation; a period in which the price primarily moves sideways before choosing a new direction for the longer term. Because of the bearish breakout through support, it seems to suggest that we could see the next price move to 23065.3538.
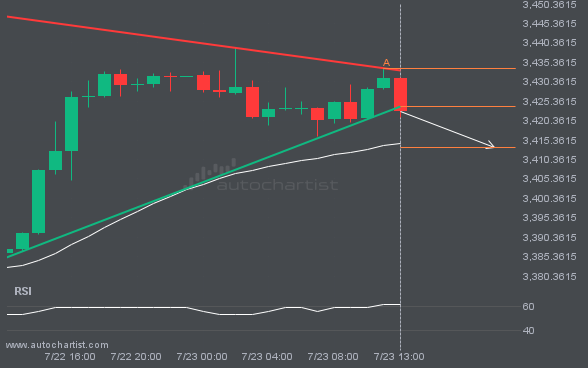
XAUUSD moved through the support line of a Triangle at 3423.8957142857143 on the 1 hour chart. This line has been tested a number of times in the past and this breakout could mean an upcoming change from the current trend. It may continue in its current direction toward 3413.4984.
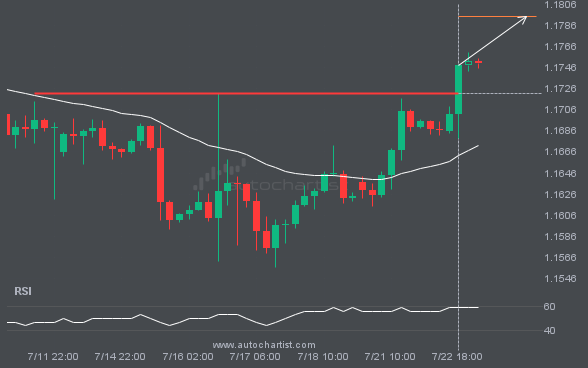
The price of EURUSD in heading in the direction of 1.1794. Despite the recent breakout through 1.1722 it is possible that it will struggle to gain momentum to the forecast price and move back in the other direction. This has happened many times in the past so watch for a possible bounce back.
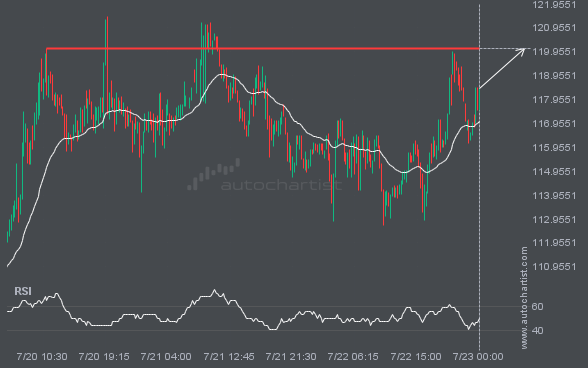
LTCUSD is about to retest a key horizontal resistance level near 120.0900. It has tested this level 3 times in the recent past and could simply bounce off like it did last time. However, after this many tries, maybe it’s ready to start a new trend.

