Skip to content
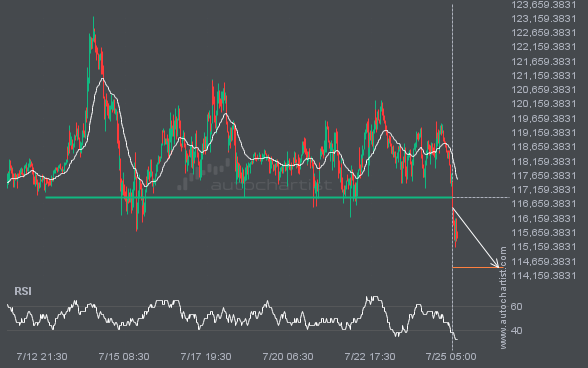
 BTCUSD has broken through a support line. It has touched this line numerous times in the last 13 days. This breakout shows a potential move to 114438.2188 within the next 3 days. Because we have seen it retrace from this level in the past, one should wait for confirmation of the breakout.
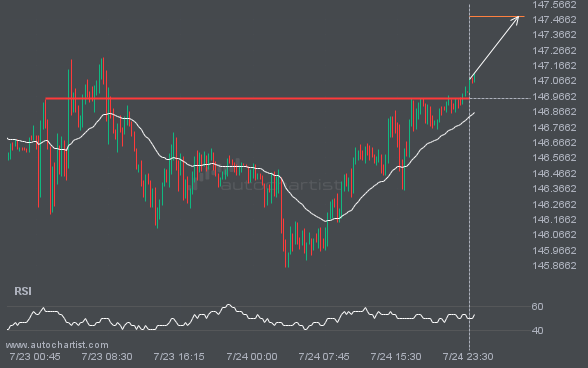
USDJPY has broken through 146.9530 which it has tested numerous times in the past. We have seen it retrace from this price in the past. If this new trend persists, USDJPY may be heading towards 147.4848 within the next 10 hours.
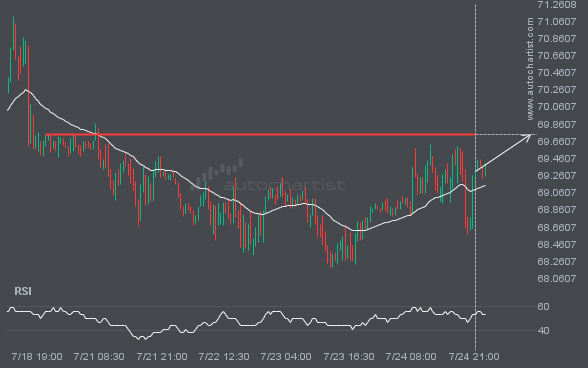
The price of BRN/USD in heading back to the resistance area. It is possible that it will struggle to break through it and move back in the other direction. The price may eventually break through, but typically the price retreats from the level a number of times before doing so.
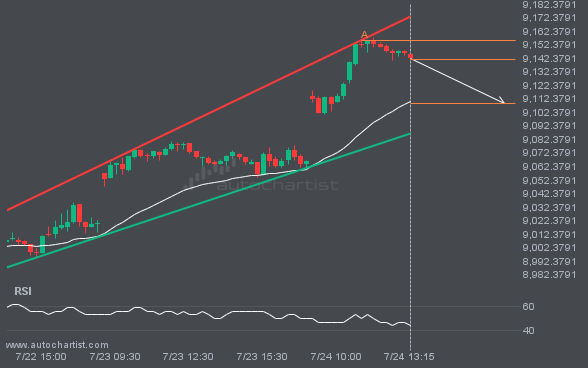
An emerging Channel Up has been detected on FTSE100 on the 15 Minutes chart. There is a possible move towards 9109.2391 next few candles. Once reaching resistance it may continue its bearish run or reverse back to current price levels.
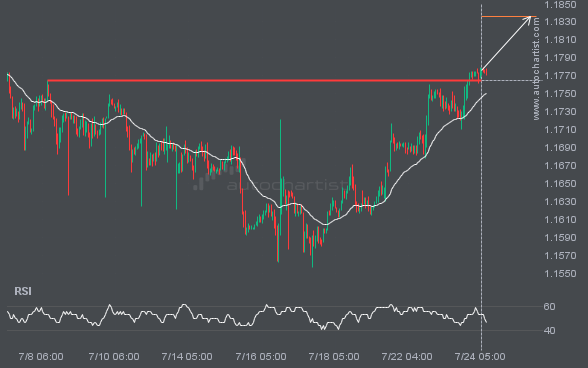
The price of EURUSD in heading in the direction of 1.1836. Despite the recent breakout through 1.1765 it is possible that it will struggle to gain momentum to the forecast price and move back in the other direction. This has happened many times in the past so watch for a possible bounce back.
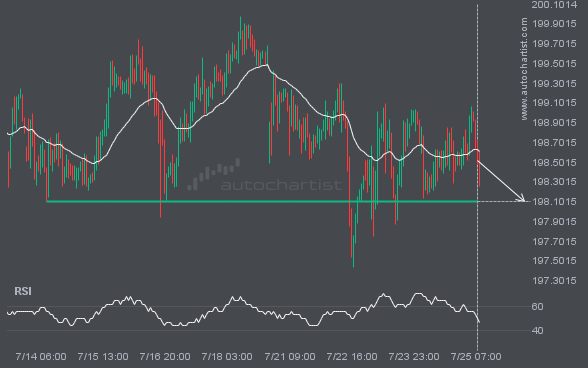
LTCUSD is moving towards a support line. Because we have seen it retrace from this level in the past, we could see either a break through this line, or a rebound back to current levels. It has touched this line numerous times in the last 7 days and may test it again within the next […]