 Skip to content
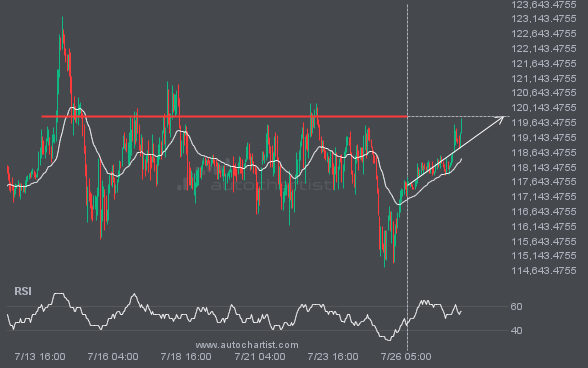
 BTCUSD is moving towards a key resistance level at 119865.1563. BTCUSD has previously tested this level 6 times and on each occasion it has bounced back off this level. Is this finally the time it will break through?
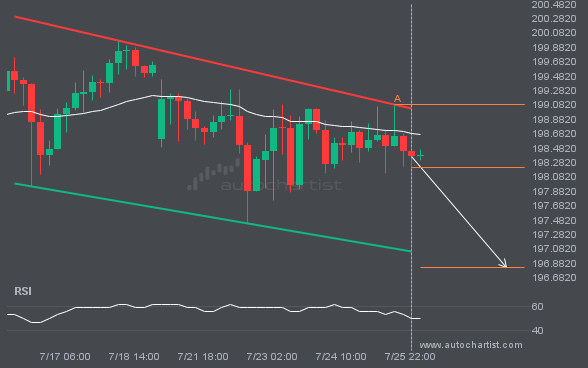
GBPJPY is trapped in a Channel Down formation, implying that a breakout is Imminent. This is a great trade-setup for both trend and swing traders. It is now approaching a resistance line that has been tested in the past. Divergence opportunists may be very optimistic about a possible breakout and this may be the start […]
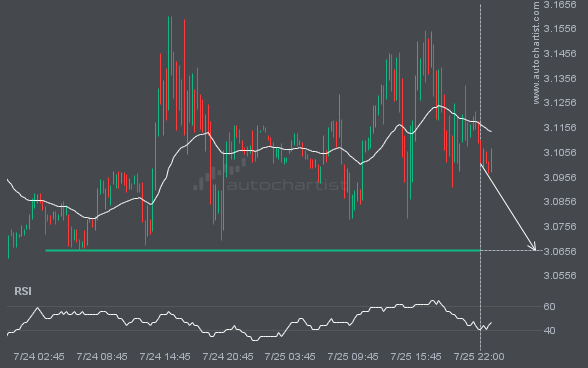
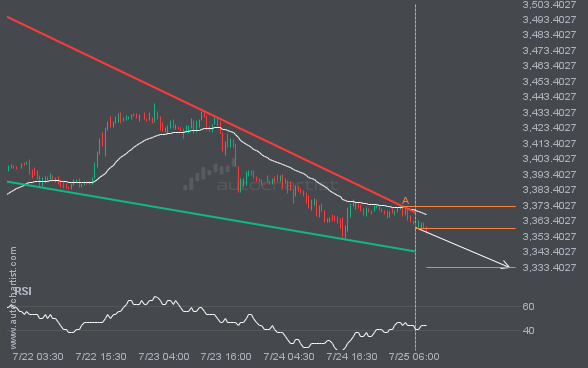
NGC/USD is en route to a very important line that will be a definite deciding factor of what is to come! We may see this trajectory continue to touch and break through 3.0660, unless it runs out of momentum and pulls back to current levels.
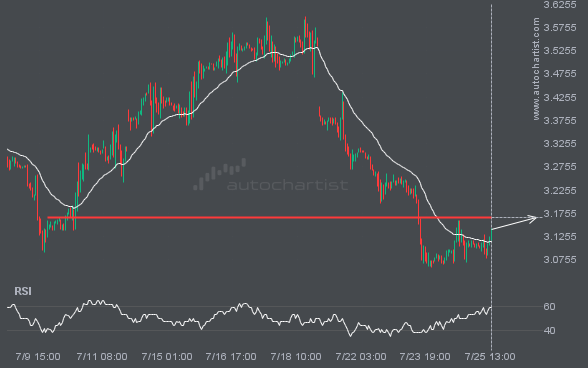
NGC/USD is heading towards a line of 3.1655. If this movement continues, the price of NGC/USD could test 3.1655 within the next 3 days. But don’t be so quick to trade, it has tested this line numerous times in the past, so this movement could be short-lived and end up rebounding.
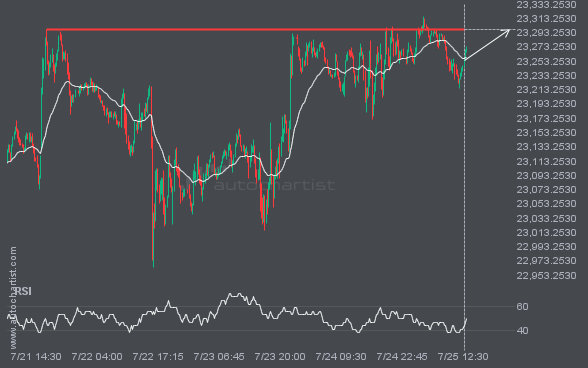
NAS100 is en route to a very important line that will be a definite deciding factor of what is to come! We may see this trajectory continue to touch and break through 23297.5332, unless it runs out of momentum and pulls back to current levels.
ETHUSD is approaching the support line of a Descending Triangle. It has touched this line numerous times in the last 8 days. If it tests this line again, it should do so in the next 2 days.
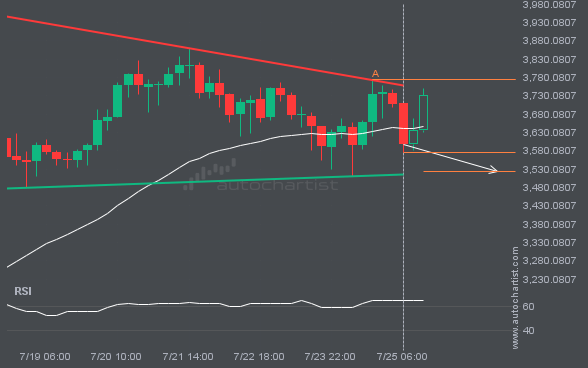
An emerging Falling Wedge has been detected on XAUUSD on the 30 Minutes chart. There is a possible move towards 3333.3035 next few candles. Once reaching resistance it may continue its bearish run or reverse back to current price levels.

