Skip to content
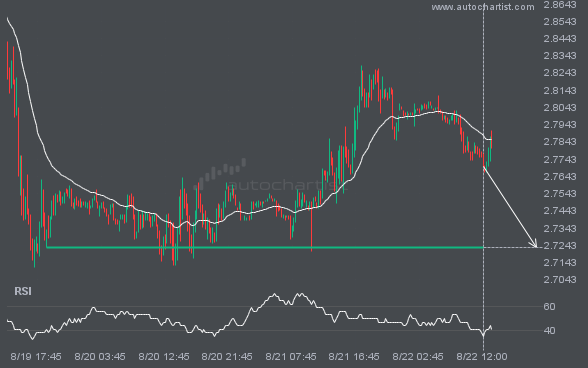
 NGC/USD is heading towards a line of 2.7230. If this movement continues, the price of NGC/USD could test 2.7230 within the next 14 hours. But don’t be so quick to trade, it has tested this line numerous times in the past, so this movement could be short-lived and end up rebounding.
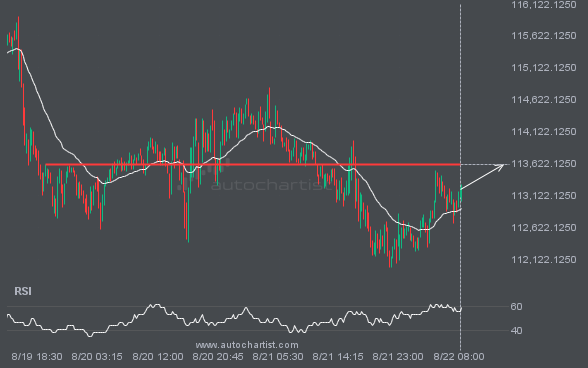
BTCUSD is approaching a resistance line at 113610.0234. If it hits the resistance line, it may break through this level to continue the bullish trend, or it may turn around back to current levels.
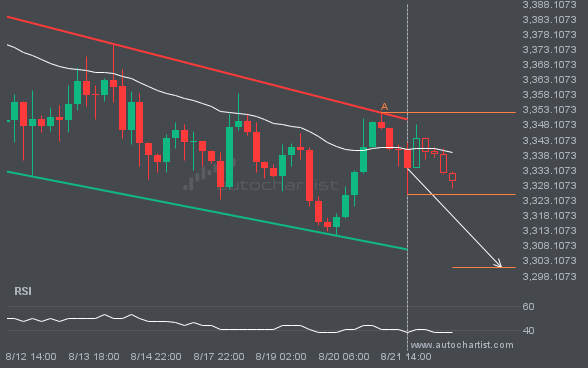
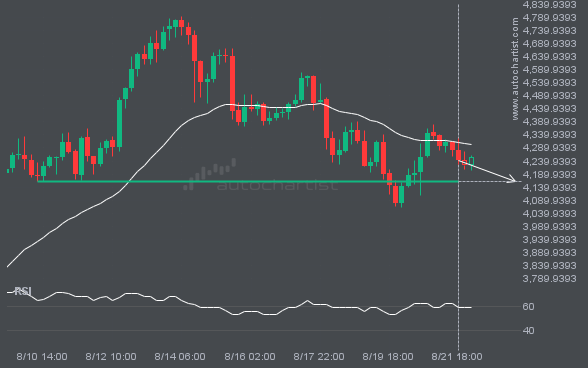
XAUUSD is heading towards the support line of a Channel Down. If this movement continues, the price of XAUUSD could test 3300.9507 within the next 2 days. It has tested this line numerous times in the past, so this movement could be short-lived and end up rebounding just like it did in the past.
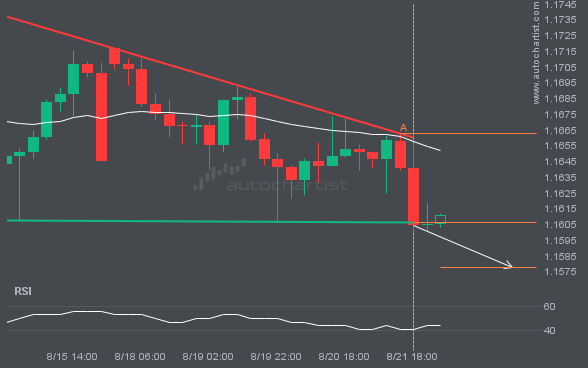
EURUSD has broken through the support line which it has tested twice in the past. We have seen it retrace from this line before, so one should wait for confirmation of the breakout before trading. If this new trend persists, a target level of around 1.1578 may materialize within the next 2 days.
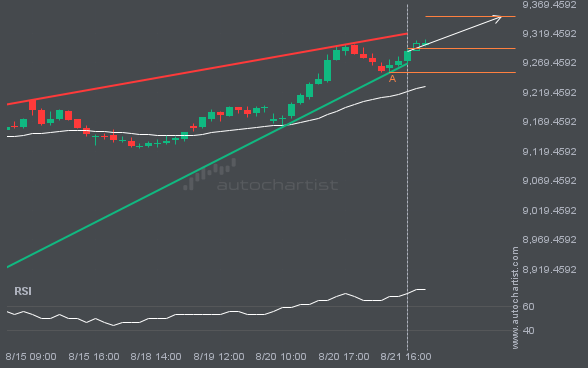
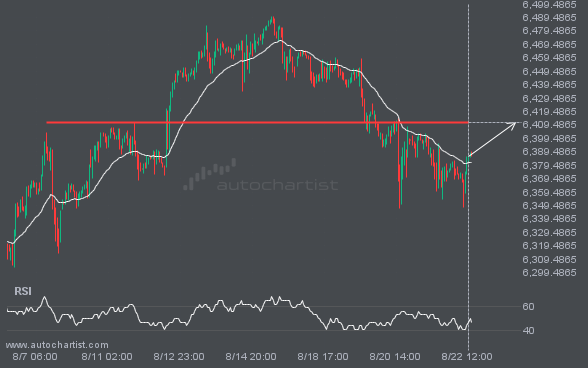
FTSE100 is heading towards the resistance line of a Rising Wedge and could reach this point within the next 11 hours. It has tested this line numerous times in the past, and this time could be no different from the past, ending in a rebound instead of a breakout. If the breakout doesn’t happen, we […]
ETHUSD is moving towards a support line. Because we have seen it retrace from this level in the past, we could see either a break through this line, or a rebound back to current levels. It has touched this line numerous times in the last 12 days and may test it again within the next […]