Skip to content
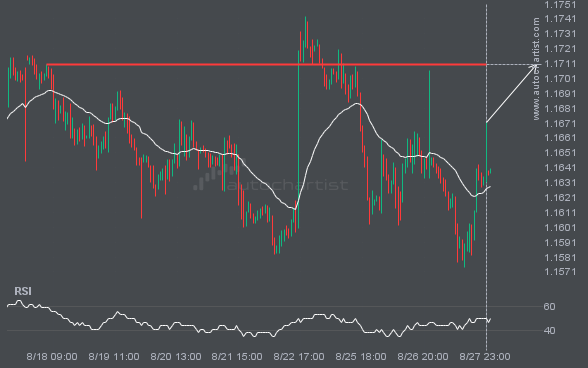
 EURUSD is heading towards a line of 1.1710. If this movement continues, the price of EURUSD could test 1.1710 within the next 2 days. But don’t be so quick to trade, it has tested this line numerous times in the past, so this movement could be short-lived and end up rebounding.
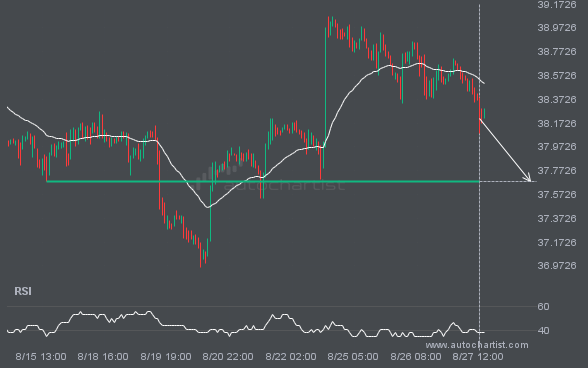
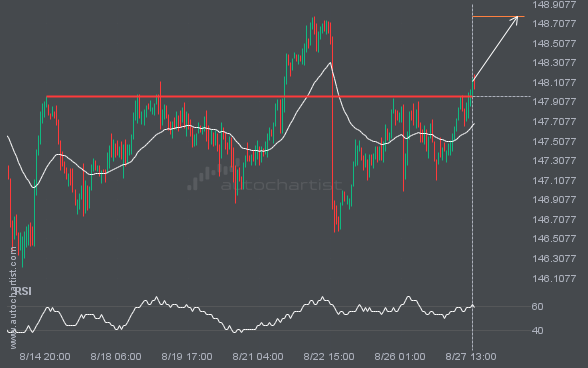
The movement of XAGUSD towards 37.6849 price line is yet another test of the line it reached numerous times in the past. We could expect this test to happen in the next 2 days, but it is uncertain whether it will result in a breakout through this line, or simply rebound back to current lines.
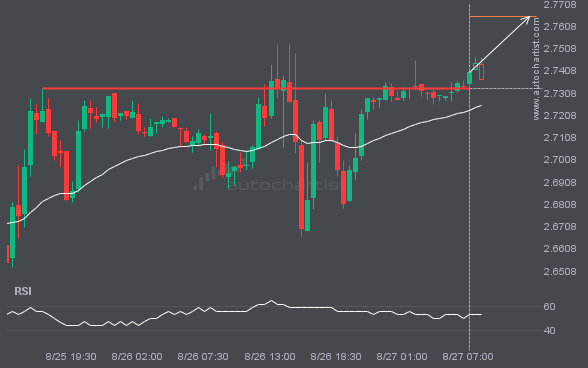
NGC/USD has broken through a resistance line. Because we have seen it retrace from this price in the past, one should wait for confirmation of the breakout before trading. It has touched this line numerous times in the last 2 days and suggests a possible target level to be around 2.7652 within the next 7 […]
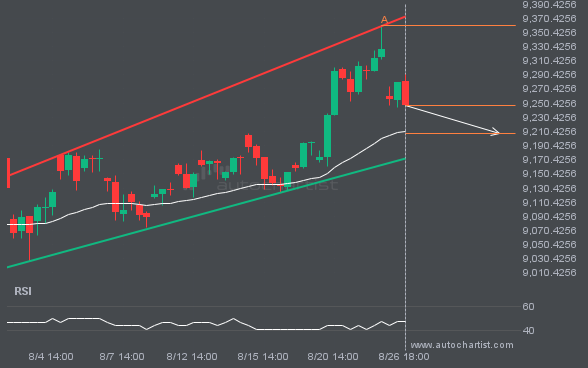
The price of LTCUSD in heading back to the resistance area. It is possible that it will struggle to break through it and move back in the other direction. The price may eventually break through, but typically the price retreats from the level a number of times before doing so.
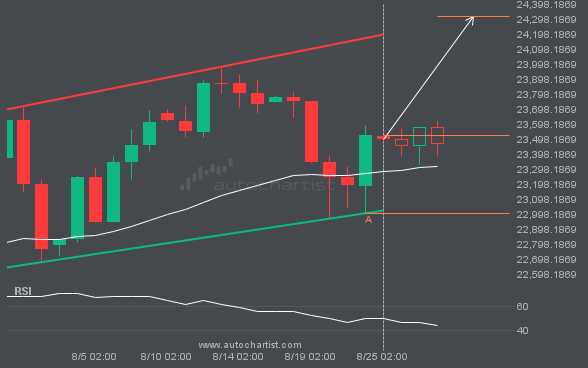
FTSE100 is trapped in a Channel Up formation, implying that a breakout is Imminent. This is a great trade-setup for both trend and swing traders. It is now approaching a resistance line that has been tested in the past. Divergence opportunists may be very optimistic about a possible breakout and this may be the start […]