Skip to content
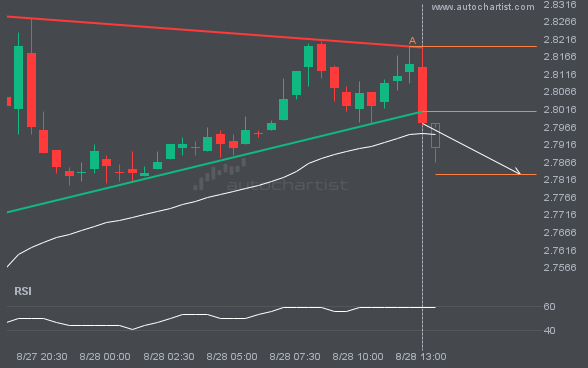
 NGC/USD has broken through a support line of a Triangle chart pattern. If this breakout holds true, we may see the price of NGC/USD testing 2.7832 within the next 5 hours. But don’t be so quick to trade, it has tested this line in the past, so you should confirm the breakout before taking any […]
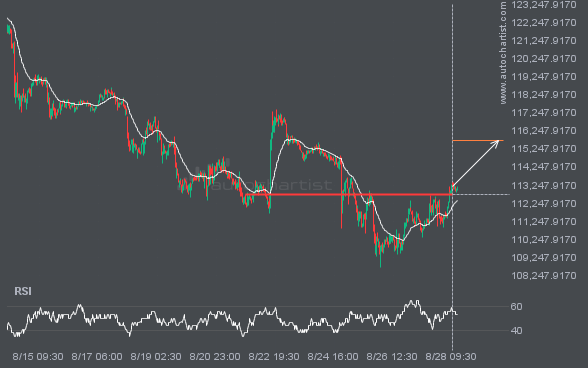
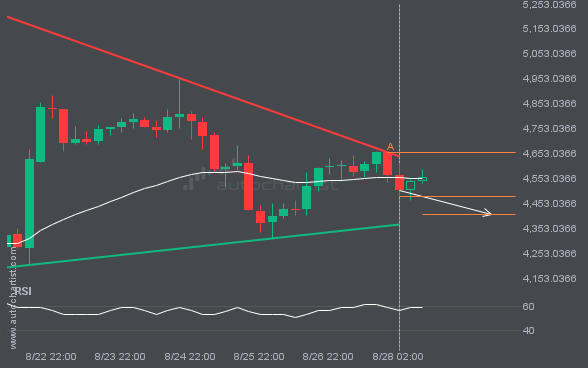
BTCUSD has broken through a line of 112724.6328 and suggests a possible movement to 115736.0234 within the next 4 days. It has tested this line numerous times in the past, so one should wait for a confirmation of this breakout before taking any action. If the breakout doesn’t confirm, we could see a retracement back […]
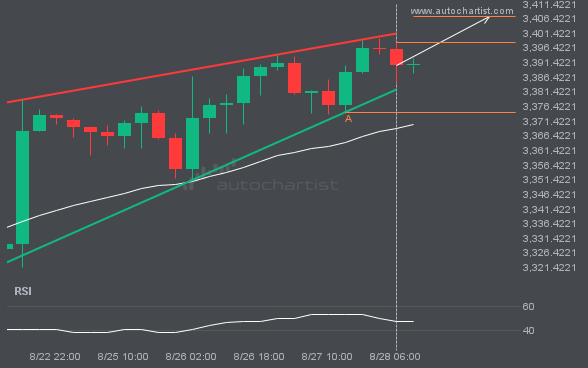
Emerging Rising Wedge pattern in its final wave was identified on the XAUUSD 4 hour chart. After a strong bullish run, we find XAUUSD heading towards the upper triangle line with a possible resistance at 3407.1392. If the resistance shows to hold, the Rising Wedge pattern suggests a rebound back towards current levels.
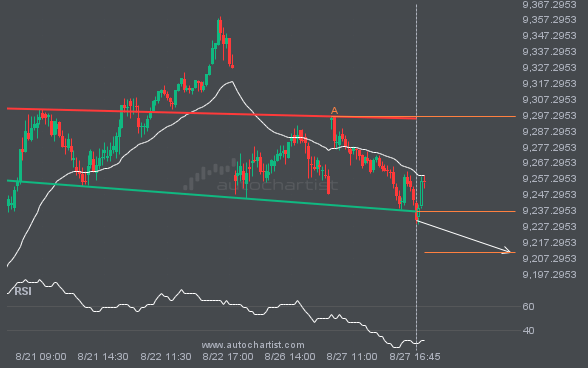
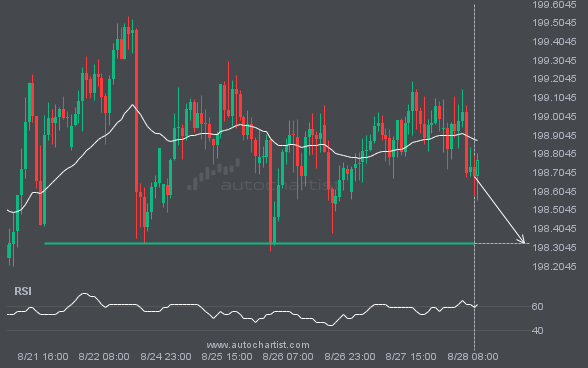
FTSE100 has broken through a support line of a Head and Shoulders chart pattern. If this breakout holds true, we may see the price of FTSE100 testing 9210.9375 within the next 10 hours. But don’t be so quick to trade, it has tested this line in the past, so you should confirm the breakout before […]
ETHUSD is moving towards a support line which it has tested numerous times in the past. We have seen it retrace from this line before, so at this stage it isn’t clear whether it will breach this line or rebound as it did before. If ETHUSD continues in its current trajectory, we could see it […]
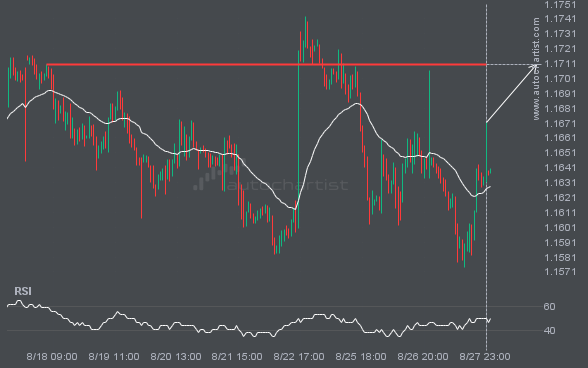
EURUSD is heading towards a line of 1.1710. If this movement continues, the price of EURUSD could test 1.1710 within the next 2 days. But don’t be so quick to trade, it has tested this line numerous times in the past, so this movement could be short-lived and end up rebounding.