 Skip to content
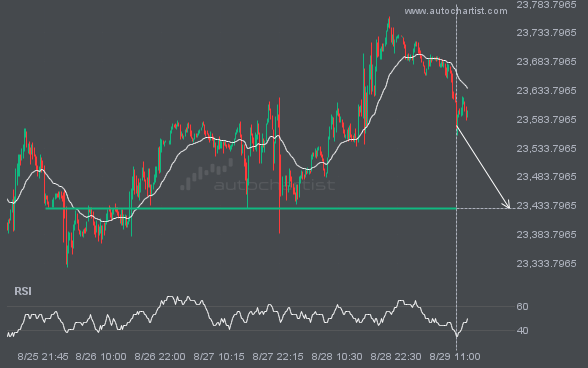
 NAS100 is en route to a very important line that will be a definite deciding factor of what is to come! We may see this trajectory continue to touch and break through 23429.0117, unless it runs out of momentum and pulls back to current levels.
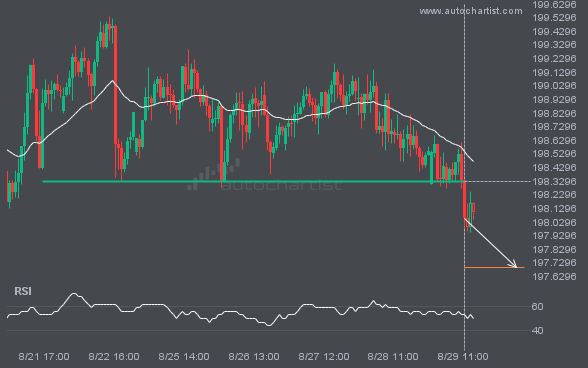
GBPJPY has broken through a support line. It has touched this line numerous times in the last 8 days. This breakout shows a potential move to 197.6960 within the next 2 days. Because we have seen it retrace from this level in the past, one should wait for confirmation of the breakout.
BRN/USD is trapped in a Channel Up formation, implying that a breakout is Imminent. This is a great trade-setup for both trend and swing traders. It is now approaching a support line that has been tested in the past. Divergence opportunists may be very optimistic about a possible breakout and this may be the start […]
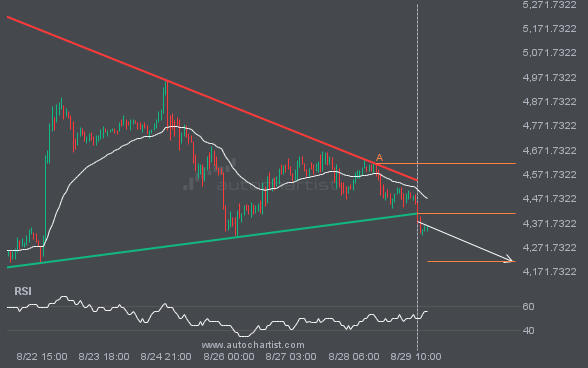
ETHUSD has broken through a support line. It has touched this line at least twice in the last 9 days. This breakout may indicate a potential move to 4212.5125 within the next 3 days. Because we have seen it retrace from this position in the past, one should wait for confirmation of the breakout before […]
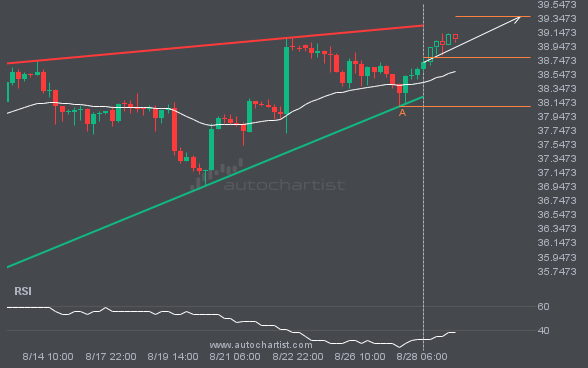
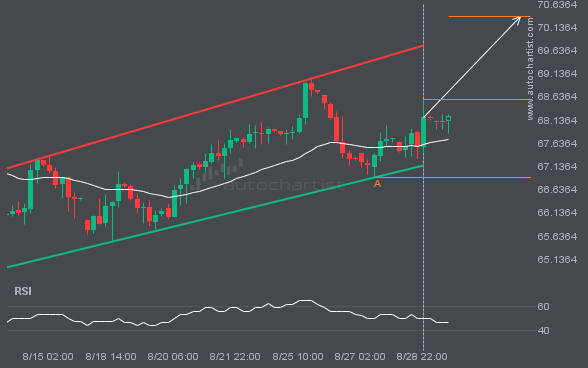
XAGUSD is heading towards the resistance line of a Rising Wedge. If this movement continues, the price of XAGUSD could test 39.3688 within the next 3 days. It has tested this line numerous times in the past, so this movement could be short-lived and end up rebounding just like it did in the past.
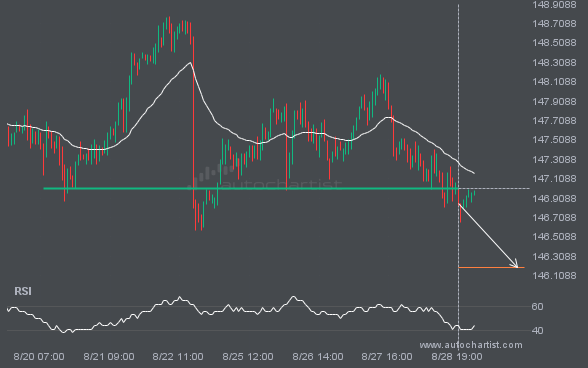
The breakout of USDJPY through the 147.0125 price line is a breach of an important psychological price that is has tested numerous in the past. If this breakout persists, USDJPY could test 146.1939 within the next 2 days. One should always be cautious before placing a trade, wait for confirmation of the breakout.
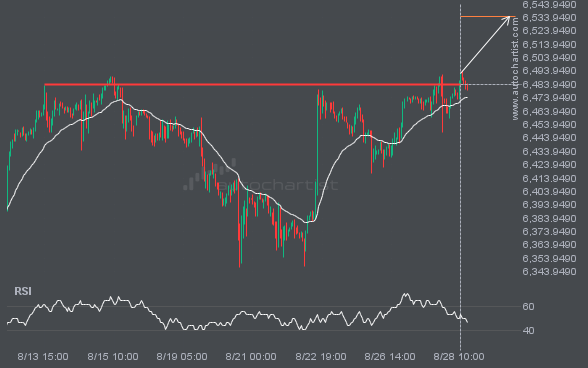
S&P500 has broken through a resistance line. It has touched this line numerous times in the last 15 days. This breakout shows a potential move to 6534.5781 within the next 3 days. Because we have seen it retrace from this level in the past, one should wait for confirmation of the breakout.

