Skip to content
 S&P500 is moving towards a support line. Because we have seen it retrace from this level in the past, we could see either a break through this line, or a rebound back to current levels. It has touched this line numerous times in the last 14 days and may test it again within the next […]
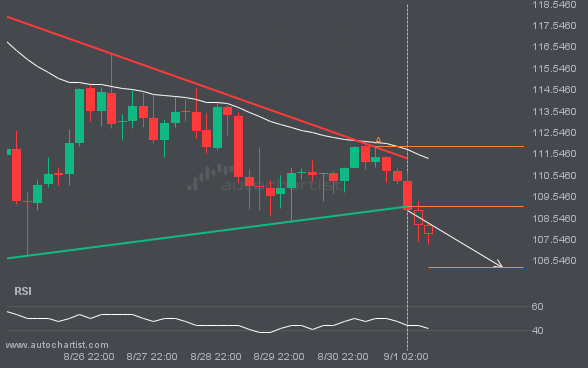
LTCUSD has broken through a support line. It has touched this line at least twice in the last 8 days. This breakout may indicate a potential move to 106.2390 within the next 2 days. Because we have seen it retrace from this position in the past, one should wait for confirmation of the breakout before […]
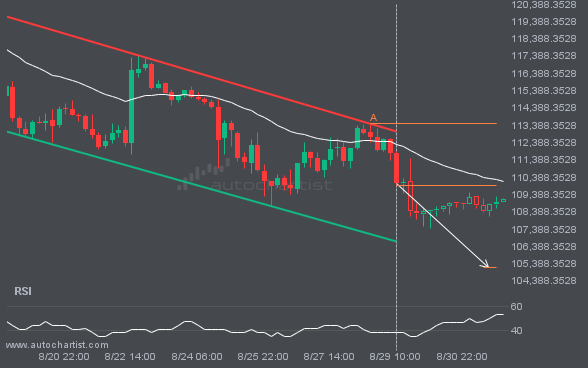
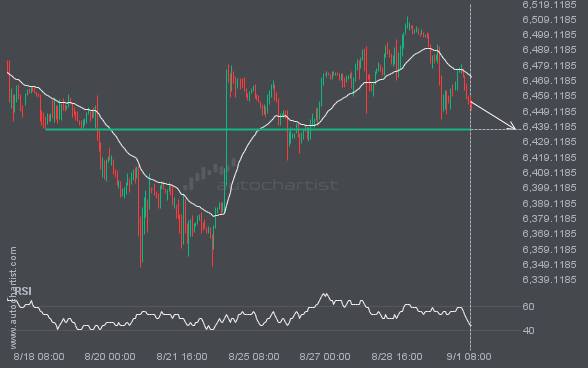
A Channel Down pattern was identified on BTCUSD at 109923.2, creating an expectation that it may move to the support line at 105170.1941. It may break through that line and continue the bearish trend or it may reverse from that line.
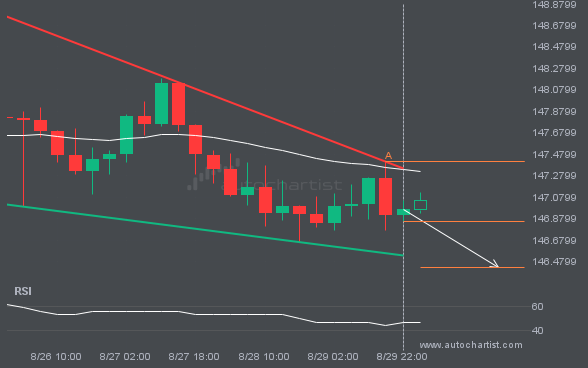
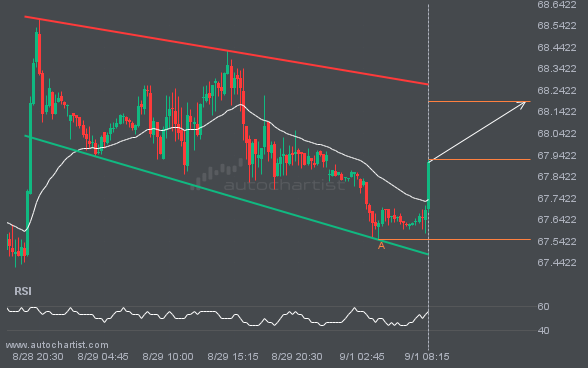
Emerging Falling Wedge pattern in its final wave was identified on the USDJPY 4 hour chart. After a strong bearish run, we find USDJPY heading towards the upper triangle line with a possible resistance at 146.4240. If the support shows to hold, the Falling Wedge pattern suggests a rebound back towards current levels.
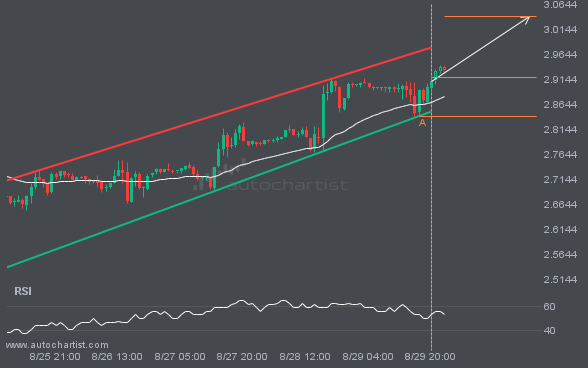
NGC/USD is heading towards the resistance line of a Channel Up and could reach this point within the next 2 days. It has tested this line numerous times in the past, and this time could be no different from the past, ending in a rebound instead of a breakout. If the breakout doesn’t happen, we […]
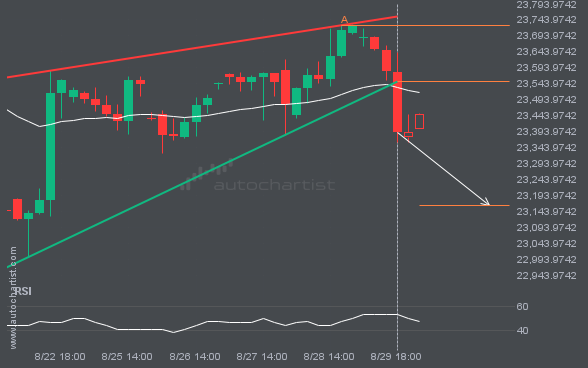
Rising Wedge pattern identified on NAS100 has broken through a support level with the price momentum continuing to move in an downward direction. A solid trading opportunity continues with the price expected to reach 23165.1714 in the next 2.