 Skip to content
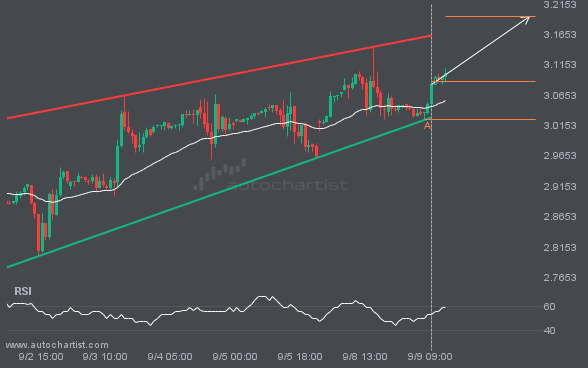
 The movement of NGC/USD towards the resistance line of a Rising Wedge is yet another test of the line it reached numerous times in the past. This line test could happen in the next 2 days, but it is uncertain whether it will result in a breakout through this line, or simply rebound back to […]
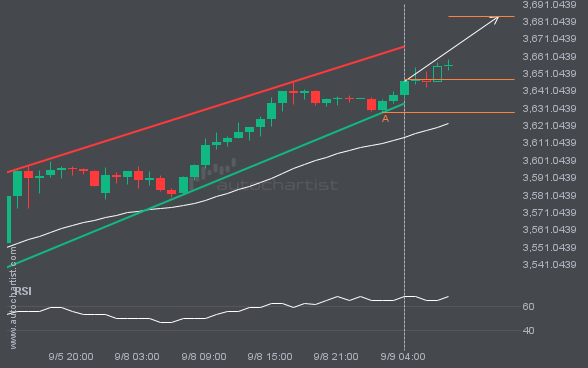
A Channel Up pattern was identified on XAUUSD at 3647.505, creating an expectation that it may move to the resistance line at 3683.8223. It may break through that line and continue the bullish trend or it may reverse from that line.
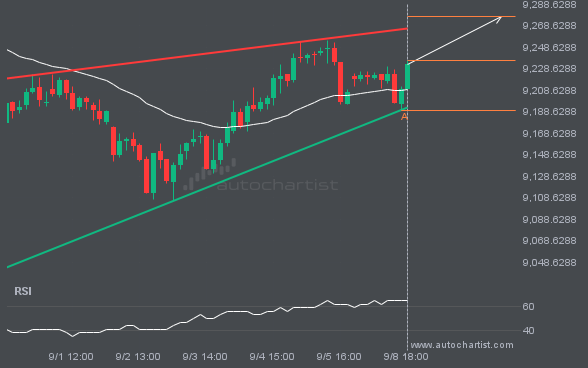
An emerging Rising Wedge has been detected on FTSE100 on the 1 hour chart. There is a possible move towards 9276.9750 next few candles. Once reaching support it may continue its bullish run or reverse back to current price levels.
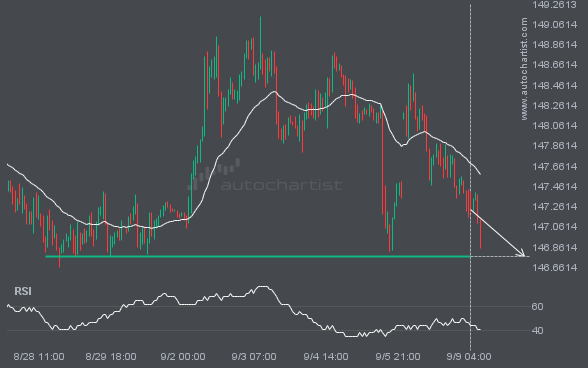
The movement of USDJPY towards 146.7645 price line is yet another test of the line it reached numerous times in the past. We could expect this test to happen in the next 2 days, but it is uncertain whether it will result in a breakout through this line, or simply rebound back to current lines.
BTCUSD is heading towards the resistance line of a Ascending Triangle and could reach this point within the next 3 days. It has tested this line numerous times in the past, and this time could be no different from the past, ending in a rebound instead of a breakout. If the breakout doesn’t happen, we […]
XAGUSD was identified at around 40.9966 having recently rebounded of the support on the 1 hour data interval. Ultimately, the price action of the stock has formed a Ascending Triangle pattern. This squeeze may increases the chances of a strong breakout. The projected movement will potentially take the price to around the 41.3918 level.
S&P500 is moving towards a support line which it has tested numerous times in the past. We have seen it retrace from this line before, so at this stage it isn’t clear whether it will breach this line or rebound as it did before. If S&P500 continues in its current trajectory, we could see it […]

