Daily Top Trade Setups: Advanced Forex, Indices, Commodities, and Stock Analysis
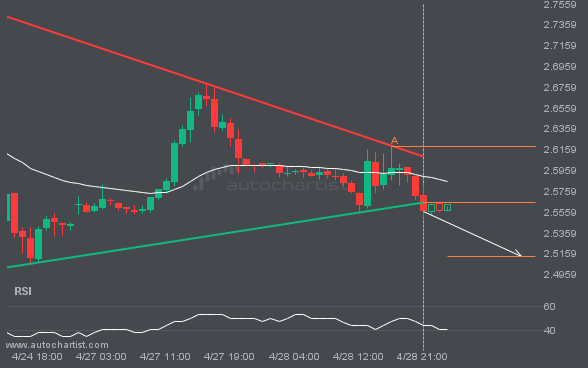
Bulls aim for 2.5133 after NGC/USD triggered a bearish formation on the 1 hour chart.
A breakout of NGC/USD through the support line of a Triangle could signal what’s ahead. If the breakout persists, we may see NGC/USD’s price test 2.5133 within the next 13 hours.
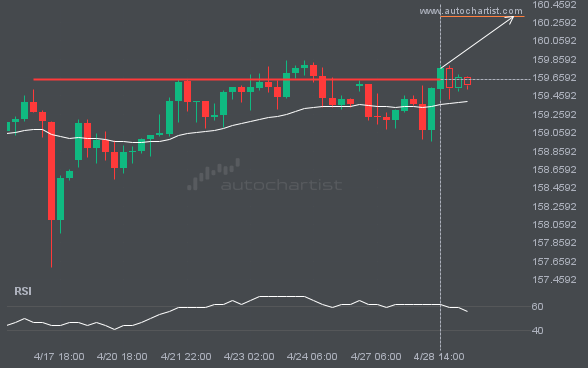
USDJPY has broken through a level it has tested 4 times recently.
A strong resistance level has been breached at 159.6405 on the 4 hour USDJPY chart. Technical analysis forecasts a move to 160.3227 within the next 1 day.
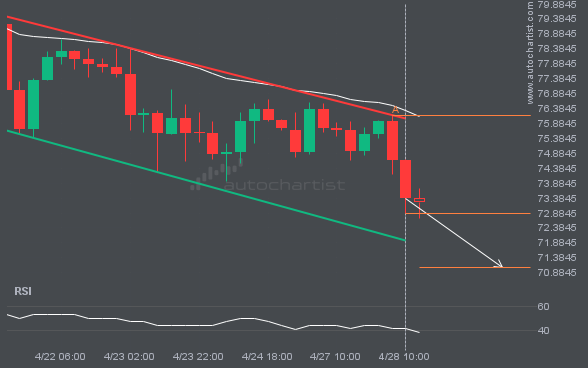
XAGUSD is approaching a support line of a Channel Down. It has touched this line numerous times in the last 11 days.
An emerging Channel Down pattern in its final wave has been identified on the XAGUSD 4 hour chart. After a strong bearish run, XAGUSD is heading toward the upper triangle trendline, with possible resistance at 71.0623. If the support holds, the Channel Down pattern suggests a rebound toward current levels.
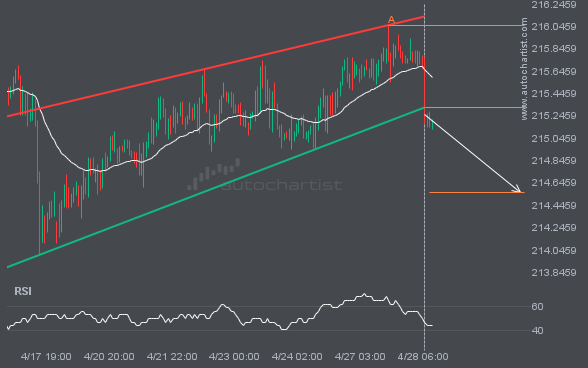
Support line has been breached by GBPJPY. This price level has been tested at least twice before.
GBPJPY has broken through the support line of a Rising Wedge technical chart pattern. Because it has retraced from this line in the past, you should wait for confirmation of the breakout before taking any action. It has touched this line twice in the last 13 days, suggesting a possible target level around 214.5601 within […]
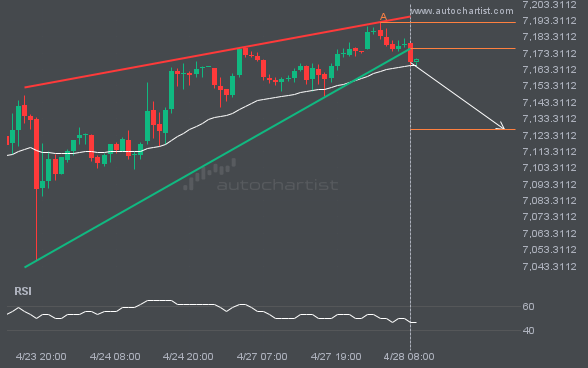
A breach of support could signal the start of a bearish trend for S&P500.
S&P500 has moved through the support line of a Rising Wedge pattern at 7176.299574468085 on the 1 hour chart. This line has been tested multiple times in the past, and this breakout could signal an upcoming change in the current trend. Price may continue in the current direction toward 7126.5572.
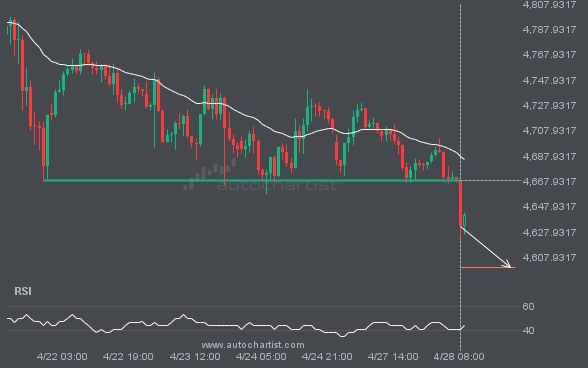
XAUUSD has broken through a level it has tested 3 times recently.
XAUUSD has broken through a line at 4668.5098. If this breakout holds, we could see the price of XAUUSD move toward 4599.9956 within the next 2 days. However, don’t be too quick to trade. It has tested this line many times in the past, so confirm the breakout before placing any trades.
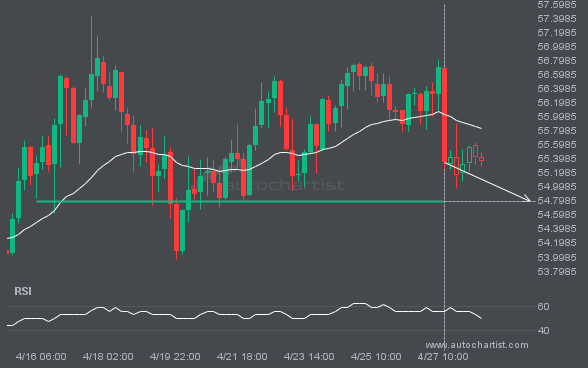
LTCUSD is heading toward a price it has tested 3 times recently.
LTCUSD is heading toward 54.7900 and could reach this level within the next 2 days. It has tested this level numerous times in the past, and this time could be no different, ending in a rebound rather than a breakout. If a breakout does not occur, we may see a retracement back to current levels.
Latest company news, corporate actions and partnership announcements
CPattern and Autochartist are proud to announce a joint technology collaboration to enable professional content personalization for traders. This technology
Autochartist, a leading global fintech provider, is proud to announce the launch of its innovative content personalization solutions. The new solutions offer online brokers the opportunity to deliver personalized content based on trader behavior such as traded instruments, hours of activity, trading style, and risk profile. The development of the solution comes as a result […]
With the addition of Autochartist to ATFX’s WeChat, traders from all levels can learn how to set their stop-loss and take-profit orders based on analysis of an asset’s volatility. The global award-winning broker ATFX has just added Autochartist analytics and actionable content to their official WeChat account. Autochartist is a program which can identify chart […]
LeapRate Exclusive… ATFX has just announced that it has teamed up with the automated market analysis software provider Autochartist to offer trading analysis to its clients in China. Autochartist offers market analysis in 28 different languages, which combined with more than 14 languages that ATFX already offers, will give ATFX clients a wide range of language […]
Trade29 is delighted to announce the availability of “C1 Analyzer Pro” for “Sierra Chart”. Powered by Autochartist, the product consists of a set of studies that can be used on 25+ futures markets. This has been a joint collaboration between Autochartist, Infinity Futures and Trade29 Software. Our initial motivation for this work was the quality […]
One of Turkey’s largest domestic banks, IS Bank has launched the Autochartist market analysis service within its mobile application, making them the first Turkish financial institution to service Autochartist customers directly on Mobile. Autochartist, an award-winning provider of financial market analysis has been integrated into the IS Bank’s mobile application to make the trading process […]
20 Feb 2018 – Autochartist is proud to announce that it has concluded acquisition of a controlling stake in VerifyMyTrade – www.verifymytrade.com – a company specializing in measuring the quality of execution in the retail forex market. The VerifyMyTrade Trust Builder enables traders to verify, via an industry acknowledged impartial service provider, whether the price they receive […]
As we enter the last stretch of 2024, silver appears to be a metal with significant potential for valuation shifts. Traders and investors increasingly focus on silver, recognizing its longstanding role in portfolios. Here’s why some savvy traders have XAGUSD in their watchlists. Disparity in the Gold/Silver Ratio Historically, the gold/silver ratio, which measures how […]
When it comes to trading, it’s easy to get lost in the charts, the data, and the endless strategies. But let’s not forget the real battleground: your mind. Welcome to the world of trading psychology, where the fiercest competition isn’t against the market – it’s against yourself. Risk tolerance, emotional control, and cognitive biases are […]
Gold trading remains as popular today as ever. It has long been one of the most sought-after assets in the world, captivating traders and investors across generations. Its enduring appeal can be attributed to several key factors that make it a staple in retail trading portfolios. Historical Significance and Trust Gold’s history as a valuable […]
The financial markets are no stranger to turbulence, but the events of early August 2024 had investors gripping their seats a little tighter. A sudden and sharp market downturn, triggered by a mix of disappointing U.S. economic data and unexpected policy shifts in Japan, highlighted the flux of the global economy. Understanding the potential impact […]
Artificial Intelligence (AI) and Machine Learning (ML) are improving quickly. The ripples are being felt in the trading industry, with increased big-data processing and improved methods to anticipate market movements and develop trading strategies. As we move into the second half of 2024, several key trends and developments are shaping this landscape, making it an […]
As the daily news headlines keep us updated on the ever-changing markets, online brokerages face unique challenges. From economic uncertainties that directly affect trading and investment choices to maintaining their business advantage in a competitive environment, here are some ongoing broker challenges shared by many online retail trading firms. These highlight the dynamic nature of […]