Daily Top Trade Setups: Advanced Forex, Indices, Commodities, and Stock Analysis
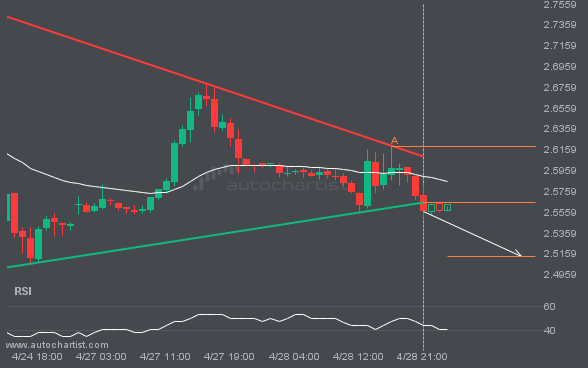
Bulls aim for 2.5133 after NGC/USD triggered a bearish formation on the 1 hour chart.
A breakout of NGC/USD through the support line of a Triangle could signal what’s ahead. If the breakout persists, we may see NGC/USD’s price test 2.5133 within the next 13 hours.
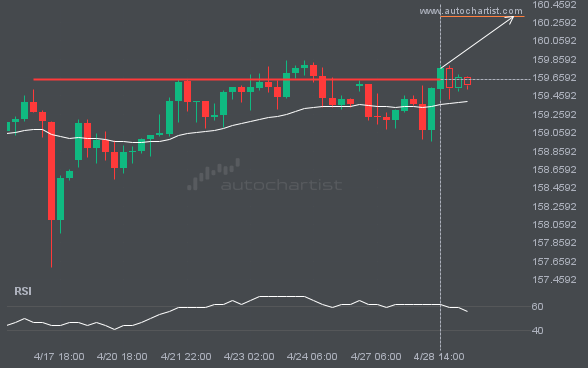
USDJPY has broken through a level it has tested 4 times recently.
A strong resistance level has been breached at 159.6405 on the 4 hour USDJPY chart. Technical analysis forecasts a move to 160.3227 within the next 1 day.
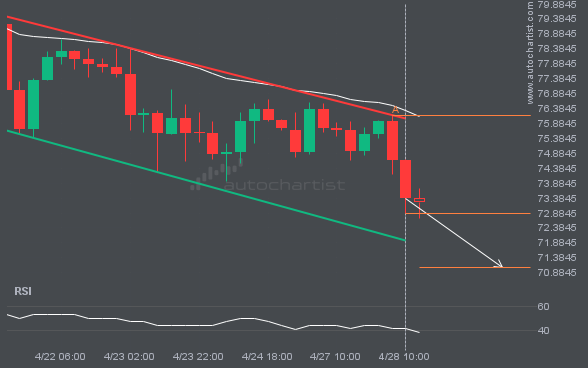
XAGUSD is approaching a support line of a Channel Down. It has touched this line numerous times in the last 11 days.
An emerging Channel Down pattern in its final wave has been identified on the XAGUSD 4 hour chart. After a strong bearish run, XAGUSD is heading toward the upper triangle trendline, with possible resistance at 71.0623. If the support holds, the Channel Down pattern suggests a rebound toward current levels.
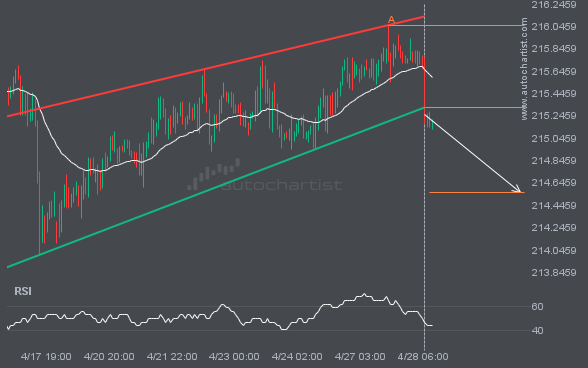
Support line has been breached by GBPJPY. This price level has been tested at least twice before.
GBPJPY has broken through the support line of a Rising Wedge technical chart pattern. Because it has retraced from this line in the past, you should wait for confirmation of the breakout before taking any action. It has touched this line twice in the last 13 days, suggesting a possible target level around 214.5601 within […]
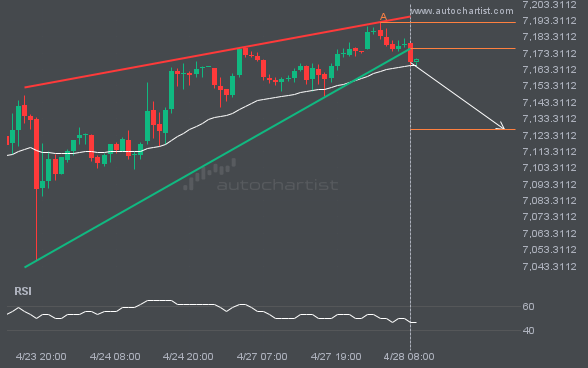
A breach of support could signal the start of a bearish trend for S&P500.
S&P500 has moved through the support line of a Rising Wedge pattern at 7176.299574468085 on the 1 hour chart. This line has been tested multiple times in the past, and this breakout could signal an upcoming change in the current trend. Price may continue in the current direction toward 7126.5572.
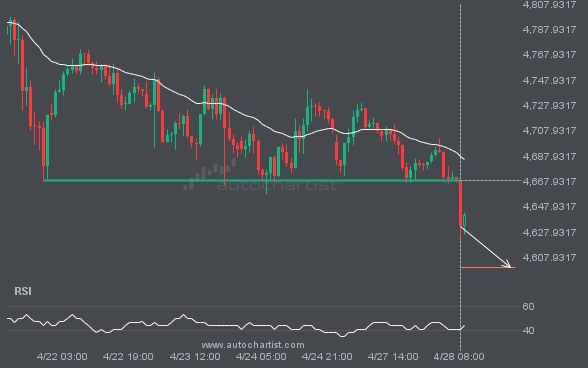
XAUUSD has broken through a level it has tested 3 times recently.
XAUUSD has broken through a line at 4668.5098. If this breakout holds, we could see the price of XAUUSD move toward 4599.9956 within the next 2 days. However, don’t be too quick to trade. It has tested this line many times in the past, so confirm the breakout before placing any trades.
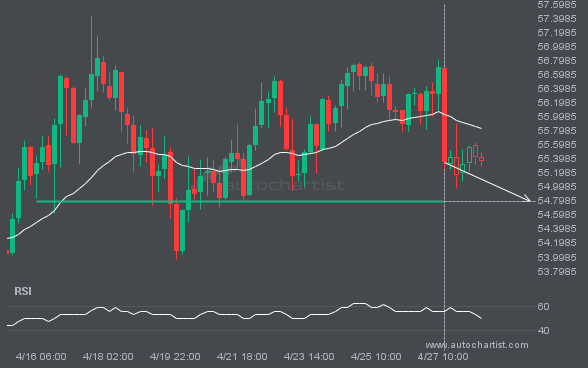
LTCUSD is heading toward a price it has tested 3 times recently.
LTCUSD is heading toward 54.7900 and could reach this level within the next 2 days. It has tested this level numerous times in the past, and this time could be no different, ending in a rebound rather than a breakout. If a breakout does not occur, we may see a retracement back to current levels.
Latest company news, corporate actions and partnership announcements
Autochartist, a world-renowned technology partner that provides real-time financial market analysis, has been recognized as the “Most Comprehensive Market Analysis Provider” by
Autochartist and Swissquote have recently embarked on an impressive collaboration in which Autochartist’s Advanced Technical Analysis has been deeply integrated into their proprietary trading platform, “Advanced Trader”. This integration creates an intuitive experience for their extensive client base of global CFD traders. One of the standout features of this integration is the ability to execute […]
Today we spotlight a new Autochartist code library developed exclusively for brokers. This product creates a synergistic relationship between Autochartist, TradingView charts, and Broker platforms. Autochartist is a global leader in technical analysis for financial markets, and through its partnership with brokers around the world, it serves millions of traders in over 100 countries by providing analysis […]
I’m excited to have the opportunity to speak with you today about your experience as the head of customer training at Autochartist. To begin, can you tell me about your experience working at Autochartist? What has been the most rewarding aspect of your role, and what have been some of the biggest challenges you’ve faced? […]
Global Trade Capital Limited (GTCFX) – a leading online brokerage house, has announced its implementation of cutting-edge data analytics solutions from Autochartist, a trusted leader in automated financial market analysis. GTCFX has chosen Autochartist for its trusted reputation in the fintech brokerage industry. The partnership will allow GTCFX to offer award-winning decision-making tools to their […]
Autochartist, a world-renowned technology partner that provides real-time market analysis for traders, was named “Most Comprehensive Market Analysis Provider – Global” by the ForexRating.com Awards 2022. This award specifically highlights excellence in investment analytics solutions for financial markets and recognizes vendors providing exceptional and innovative infrastructure, technology, and data solutions. Autochartist provides a broad range […]
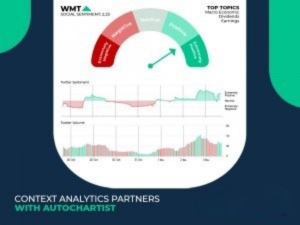
Context Analytics (CA), a global leader in Unstructured Financial Data processing has partnered with Autochartist to distribute its social media sentiment analysis tool into Europe, the United Kingdom, and APAC. Context Analytics (CA), a global leader in Unstructured Financial Data processing has partnered with Autochartist to distribute its social media sentiment analysis tool into Europe, the United […]
Risk management remains a cornerstone of successful trading strategies. As the financial markets become increasingly complex and volatile, the need for advanced risk management tools has never been greater. In 2024, several key developments and trends have shaped the landscape of risk management, offering traders ways to mitigate and manage risks effectively. Volatility Analysis Tools […]
Let’s face it – teaching kids and teens about money is a must these days. Whether it’s explaining the difference between needs and wants, or why saving for that cool gadget is more rewarding than buying it impulsively, financial literacy is a life skill that can make a huge difference in a child’s future. Being […]
Retiring early and living life on your own terms – sounds like a dream, right? For many younger folks, especially Millennials and Gen Z, that dream has a name: the FIRE movement. It stands for Financial Independence, Retire Early, and it’s all about saving aggressively and investing wisely to achieve that dream. But let’s get […]
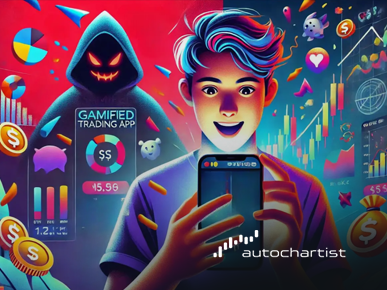
Gamification of trading is increasing the popularity of something once reserved for the suit and tie brigade. Modern mobile trading apps have literally put financial markets in the palm of our hands. They have made it easier than ever for young people to dive into the stock market with just a few taps on their […]
Imagine a time when trading technology meant frantically dialling your broker on a rotary phone, hoping the market hadn’t moved against you before they picked up. Fast forward to today, where algorithms trade billions in microseconds, and AI trading tools are your personal market whisperer. The journey from telephone-based trading to today’s high-tech platforms is […]
Understanding CARF and MiCA’s Impact on the Digital Asset Market The increased adoption of digital assets globally has highlighted the importance of regulatory developments in the cryptocurrency space. Digital assets offer new ways to raise capital, streamline payments, and foster innovation. All of which leads to more inclusive financial services for consumers and businesses alike. […]