Daily Top Trade Setups: Advanced Forex, Indices, Commodities, and Stock Analysis
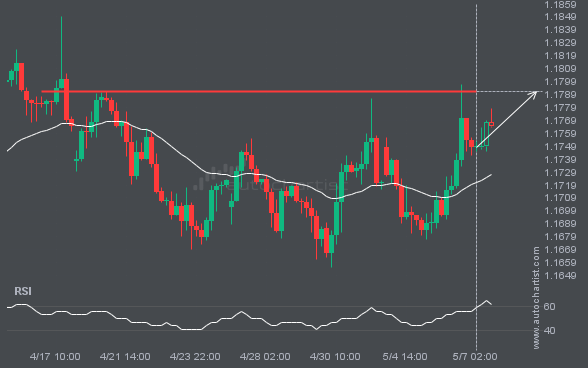
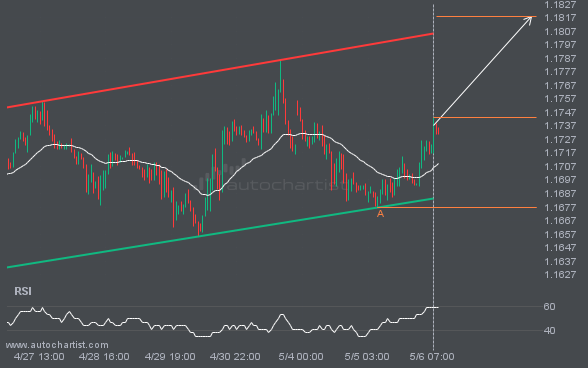
EURUSD is heading toward a price it has tested 3 times recently.
EURUSD is approaching a critical level that could be a key deciding factor for what comes next. We may see this trajectory continue to test and break through 1.1791, unless it loses momentum and pulls back to current levels.
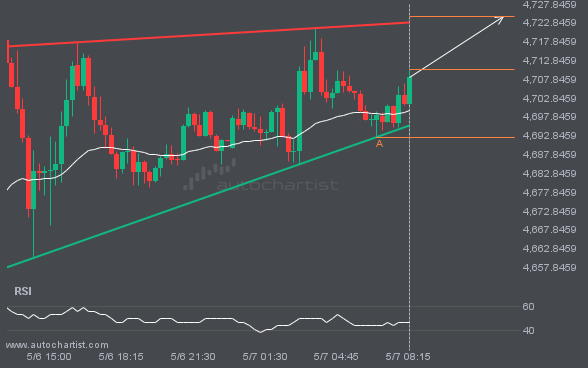
XAUUSD is approaching a resistance line that has been tested at least twice before
XAUUSD is moving toward a resistance line. Since it has retraced from this line before, we may see either a breakout through this line or a rebound to current levels. It has touched this line numerous times in the last 19 hours and may test it again within the next 6 hours.
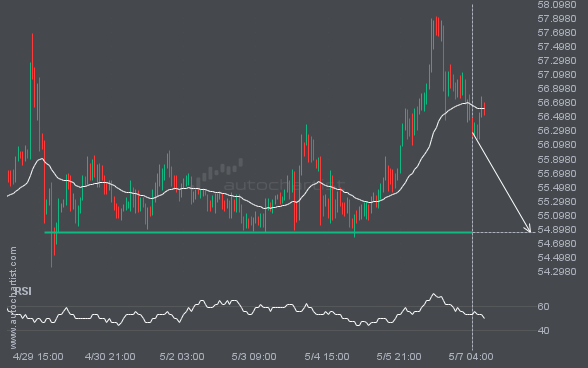
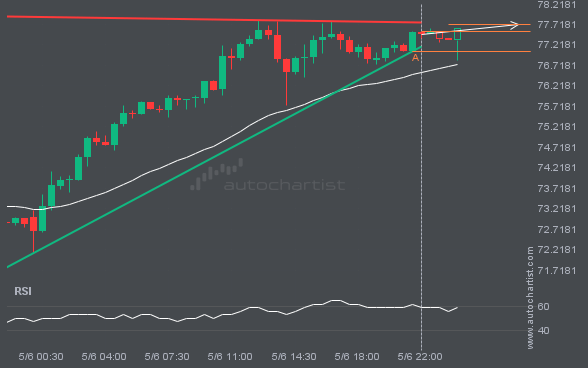
LTCUSD is likely to test 54.8600 in the near future. Where to next?
LTCUSD is approaching a support line at 54.8600. If it hits the support line, it may break through this level to continue the bearish trend, or it may return to current levels.
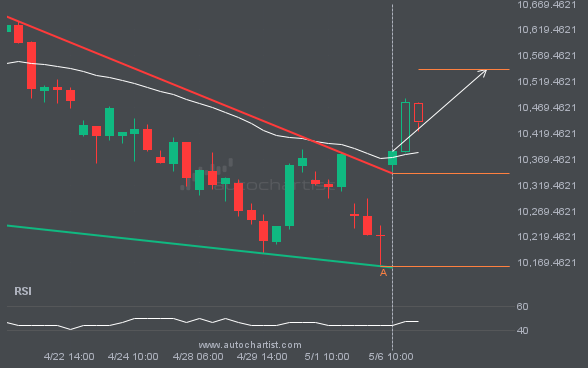
FTSE100 has broken out of the Falling Wedge pattern and is expected to reach 10543.0275 soon.
FTSE100 has broken through the resistance line of a Falling Wedge technical chart pattern. Because it has retraced from this line in the past, you should wait for confirmation of the breakout before taking any action. It has touched this line twice in the last 21 days, which suggests a possible target around 10543.0275 within […]
An important resistance line is being approached by XAGUSD. This price has been tested numerous times in the last 2 days
The movement of XAGUSD toward the resistance line of a Ascending Triangle is yet another test of the line it has reached numerous times in the past. This test of the line could occur within the next 5 hours, but it is uncertain whether it will result in a breakout through this line or simply […]
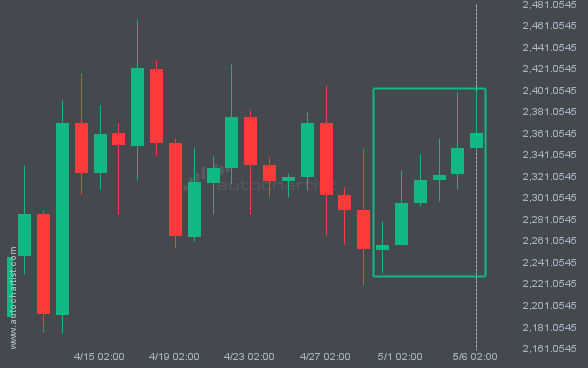
ETHUSD recorded 6 consecutive daily bullish candles.
ETHUSD: Significant movement recorded.
EURUSD is signaling a possible trend reversal on intraday charts, as the price fails to breach support.
EURUSD is moving toward a resistance line. Since it has retraced from this line before, we may see either a breakout through this line or a rebound to current levels. It has touched this line numerous times in the last 13 days and may test it again within the next 3 days.
Latest company news, corporate actions and partnership announcements
As a leading global provider of multi-award-winning broker tools and services, Autochartist remains committed to innovation, digital transformation and customer service. Join us for an exclusive interview with Ilan Azbel, the CEO of Autochartist, as he shares invaluable insights into the company’s journey and offers a glimpse into the future of digital brokerage. Q: Autochartist […]
Autochartist, an undisputed leader in the financial trading tools landscape, is thrilled to announce the debut of its state-of-the-art platform, LaunchPad. In a monumental move, Autochartist will make LaunchPad available completely free to currency and CFD brokers. Allowing brokers to embed almost any modern website into MetaTrader. Historically, MetaTrader was limited to embedding older, non-responsive versions of […]
In a significant stride forward in broker tool development, Autochartist recently announced the introduction of LaunchPad, a pioneering product for currency and CFD brokers. This announcement coincides with the presence of Autochartist representatives at the IFXExpo in Dubai, running from January 16th to 18th, 2024. We are offering brokers an unprecedented ability to embed almost […]
In a continuing effort to streamline engagement between brokers and traders, Autochartist has expanded on its promise with automated WhatsApp alerts on market insights. Autochartist is pleased to announce the addition of WhatsApp messaging alerts to its existing messaging services, facilitating seamless communication between brokers and their traders. While the platform remains broker-controlled, this new […]
Autochartist introduces its all-in-one Research Portal, a transformative market analysis delivery system that seamlessly channels Autochartist’s entire suite of tools and products through one customisable, responsive user interface. At the heart of the Research Portal is a promise of simplicity. Brokers can now effortlessly integrate an array of trading tools, eliminating the need for extensive developmental work […]
Autochartist, a leading global provider of technical analysis and trading solutions, is excited to announce the addition of Braze Emails marketing automation platform integration for its content. This new addition further bolsters Autochartist’s existing impressive lineup of integrations, which include powerhouse platforms such as Salesforce Marketing Cloud, Sendy, Sendgrid, Silverpop, Solitics, Amazon SES, Constant Contact, […]
llan Azbel, CEO and Founder of Autochartist, has over 20 years experience in technology, 15 years in the financial markets and an academic background in mathematics, computer-science and engineering. Hi Ilan, thank you for joining us today. With Amazon, Tesla and Apple blowing-up the media daily, everybody would love the opportunity to purchase Stocks and I […]
Developing a proprietary trading platform can be an expensive and exhausting investment. However, we are seeing that brokers who choose this path are reaping the rewards. As the industry matures, so do the technological service providers. As a result, we see an upward trend in brokers building their own platforms or starting the process of […]
Ilan Azbel, CEO and Founder of Autochartist, has over 20 years of experience in technology, 15 years in the financial markets and an academic background in mathematics, computer science and engineering. Hi Ilan, thank you for joining us today. It has been over a year now since you officially launched your ‘Automated Social Media’ product. […]
There has been a lot written about the recent massive influx of retail traders in the financial markets. However, what hasn’t been discussed is the rise in the number of brokers operating in the space. This has created an intensely competitive and noisy space, where standing out in the crowd can be a herculean task. […]
By Hein van Eeden, Senior Dev @ Autochartist.com.In the beginning of 2010’s Autochartist decided to integrate our Technical Analysis Chart Patterns into MetaTrader 4 (and a little later into MetaTrader 5). This was in the form of indicators, one for each product Autochartist was offering at the time, using DLLs to communicate with our services […]
By Tamryn Hayne, Before migrating to Salesforce, we worked with various record keeping applications that just didn’t cut it for us. When you have many clients to store information for and in order to keep up with your business development productivity targets, you need to have a CRM that will do exactly what you need […]