MARKET ANALYSIS

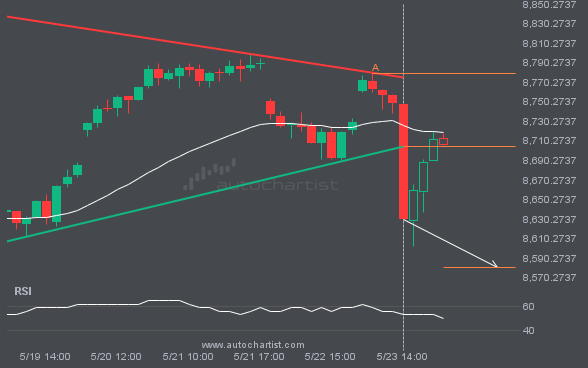
FTSE100 has broken through a support line of a Triangle chart pattern. If this breakout holds true, we may see the price of FTSE100 testing 8580.9758 within the next 8 hours. But don’t be so quick to trade, it has tested this line in the past, so you should confirm the breakout before taking any action.
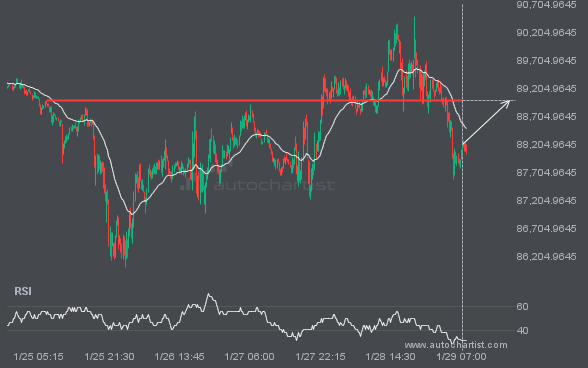
The breakout of S&P500 through the 5861.2402 price line is a breach of an important psychological price that is has tested numerous in the past. If this breakout persists, S&P500 could test 5884.4248 within the next 11 hours. One should always be cautious before placing a trade, wait for confirmation of the breakout.

An emerging Rising Wedge has been detected on XAGUSD on the 4 hour chart. There is a possible move towards 33.9280 next few candles. Once reaching support it may continue its bullish run or reverse back to current price levels.

FTSE100 has broken through a support line of a Triangle chart pattern. If this breakout holds true, we may see the price of FTSE100 testing 8580.9758 within the next 8 hours. But don’t be so quick to trade, it has tested this line in the past, so you should confirm the breakout before taking any […]

GBPJPY is moving towards a support line. Because we have seen it retrace from this line before, we could see either a break through this line, or a rebound back to current levels. It has touched this line numerous times in the last 10 days and may test it again within the next 2 days.

ETHUSD is heading towards a line of 2439.7800. If this movement continues, the price of ETHUSD could test 2439.7800 within the next 19 hours. But don’t be so quick to trade, it has tested this line numerous times in the past, so this movement could be short-lived and end up rebounding.

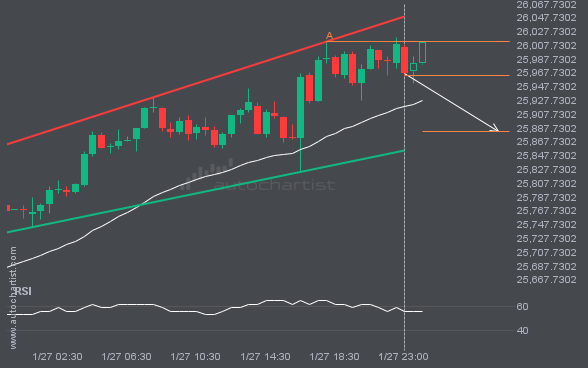
NAS100 is heading towards the support line of a Falling Wedge. If this movement continues, the price of NAS100 could test 20945.6490 within the next 2 days. It has tested this line numerous times in the past, so this movement could be short-lived and end up rebounding just like it did in the past.

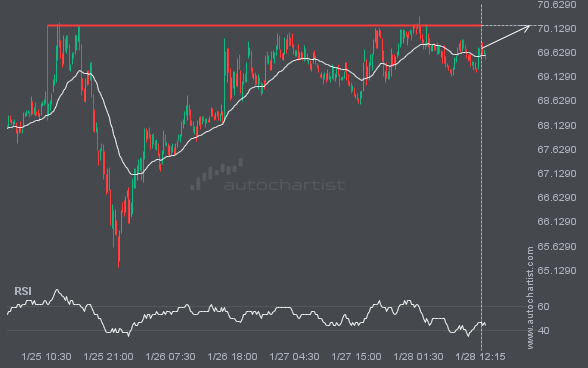
This trade setup on BRN/USD is formed by a period of consolidation; a period in which the price primarily moves sideways before choosing a new direction for the longer term. Because of the bullish breakout through resistance, it seems to suggest that we could see the next price move to 65.0051.