Autochartist General
MARKET ANALYSIS

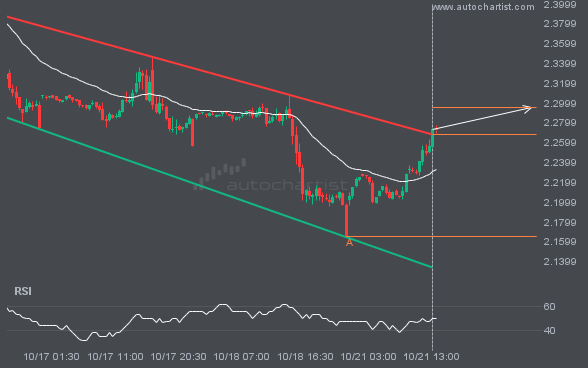
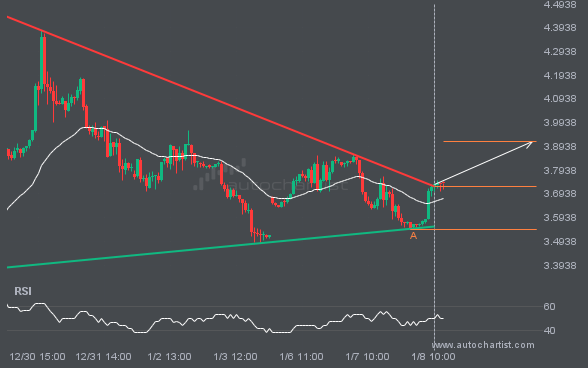
NGC/USD moved through the resistance line of a Channel Down at 2.268646341463415 on the 30 Minutes chart. This line has been tested a number of times in the past and this breakout could mean an upcoming change from the current trend. It may continue in its current direction toward 2.2957.

FTSE100 is trapped in a Channel Up formation, implying that a breakout is Imminent. This is a great trade-setup for

NAS100 is heading towards the resistance line of a Triangle and could reach this point within the next 2 days.

BTCUSD is moving towards a resistance line which it has tested numerous times in the past. We have seen it

EURUSD has experienced an exceptionally large amount of consecutive bearish candles to reach a price of 1.0859 in the last

Emerging Channel Up detected on FTSE100 – the pattern is an emerging one and has not yet broken through resistance,

LTCUSD is moving towards a resistance line. Because we have seen it retrace from this line before, we could see