Autochartist General
MARKET ANALYSIS

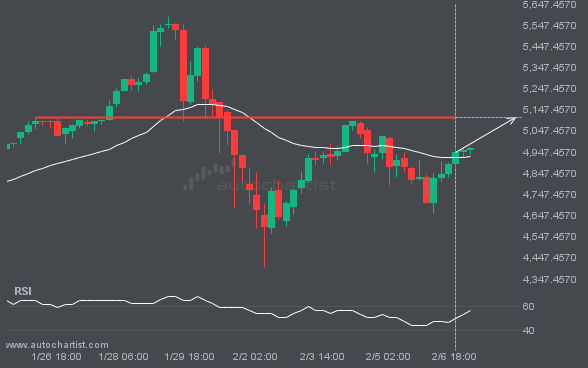
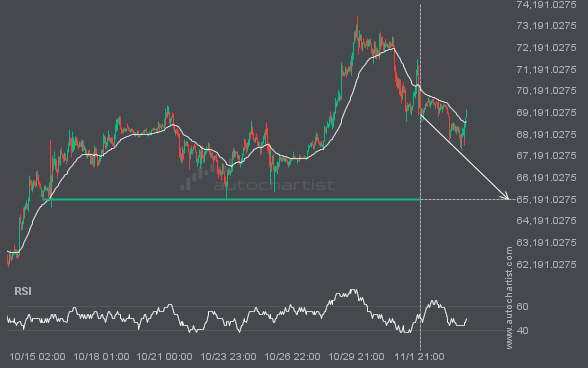
The movement of BTCUSD towards 65171.5391 price line is yet another test of the line it reached numerous times in the past. We could expect this test to happen in the next 3 days, but it is uncertain whether it will result in a breakout through this line, or simply rebound back to current lines.
USDJPY moved through the support line of a Triangle at 151.83445454545458 on the 4 hour chart. This line has been

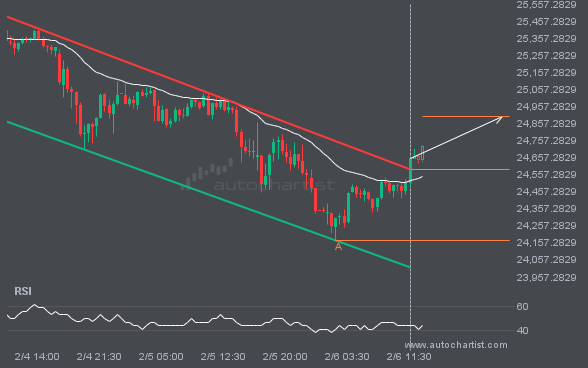
Emerging Channel Down pattern in its final wave was identified on the S&P500 30 Minutes chart. After a strong bearish

The price of BRN/USD in heading back to the support area. It is possible that it will struggle to break

The movement of BTCUSD towards 65171.5391 price line is yet another test of the line it reached numerous times in

EURUSD is en route to a very important line that will be a definite deciding factor of what is to

ETHUSD experienced an extremely large move that lasted 2. This movement is in the 2.0 percentile and is uncommon. It

USDJPY has experienced an extremely big movement in last 30 days. It may continue the trend, but this would make