Skip to content
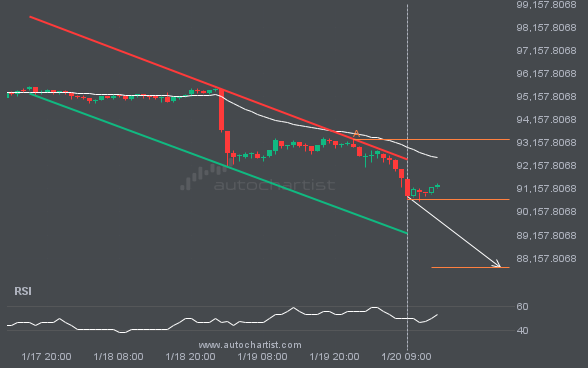
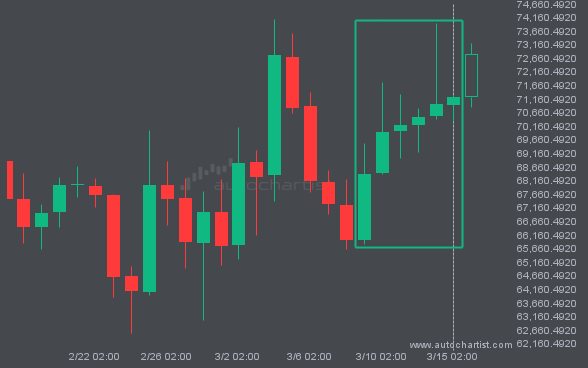
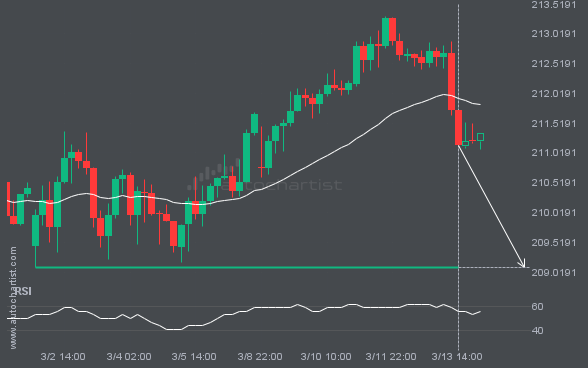
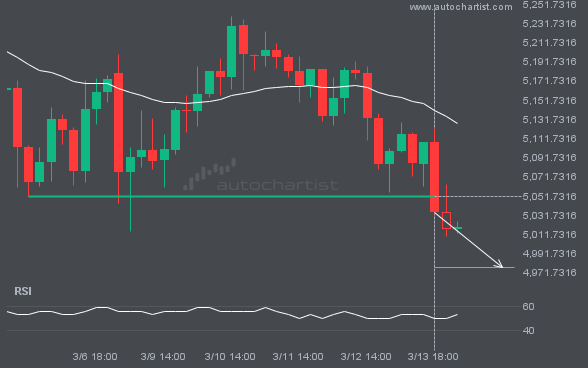
 An emerging Channel Down has been detected on BTCUSD. The pattern has not yet broken through resistance, but the price is expected to move up over the next few hours. At the time the pattern was found, the price was 90698.47, and it is expected to move to 87756.7250.