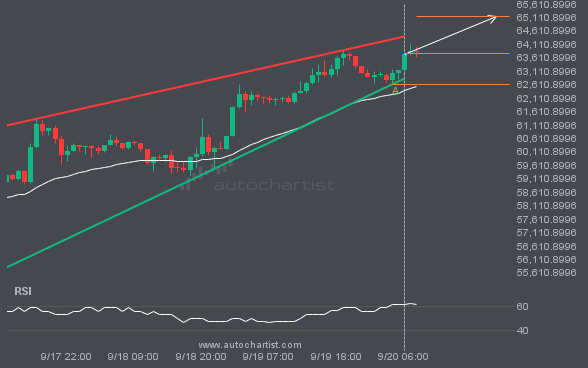
A Rising Wedge pattern was identified on BTCUSD at 63760.09, creating an expectation that it may move to the resistance line at 65144.4650. It may break through that line and continue the bullish trend or it may reverse from that line.
 Skip to content
 A Rising Wedge pattern was identified on BTCUSD at 63760.09, creating an expectation that it may move to the resistance line at 65144.4650. It may break through that line and continue the bullish trend or it may reverse from that line.
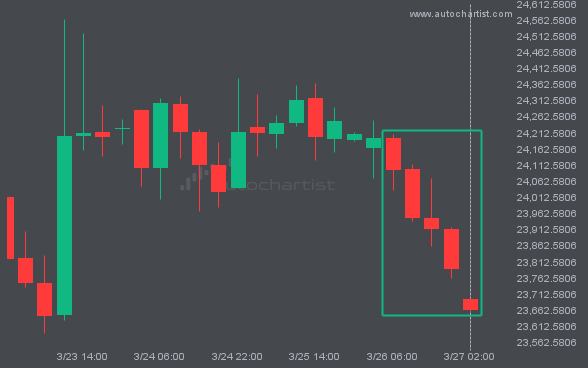
NAS100 posted 5 consecutive candles over the last 20 hours — an unusually large movement.
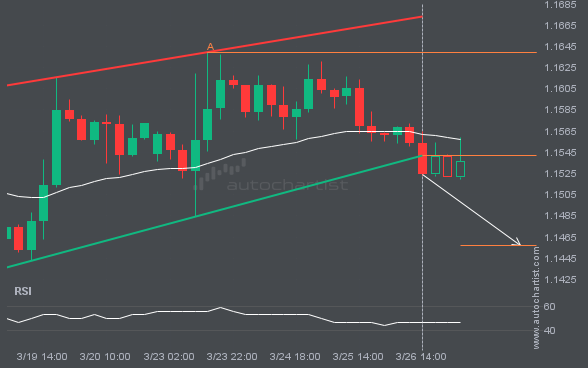
A breakout of EURUSD through the support line of a Channel Up could signal what’s ahead. If the breakout persists, we may see EURUSD’s price test 1.1458 within the next 2 days.
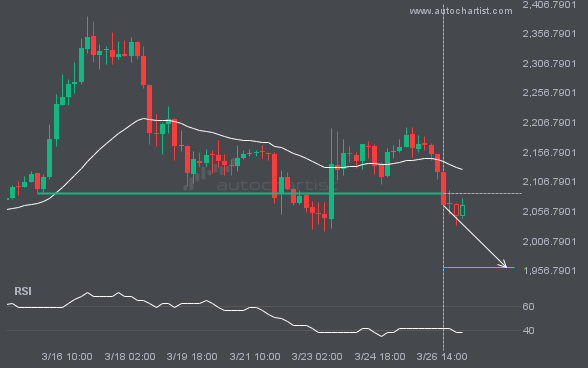
ETHUSD has broken through a line at 2087.0801. If this breakout holds, we could see the price of ETHUSD move toward 1962.2170 within the next 3 days. However, don’t be too quick to trade. It has tested this line many times in the past, so confirm the breakout before placing any trades.
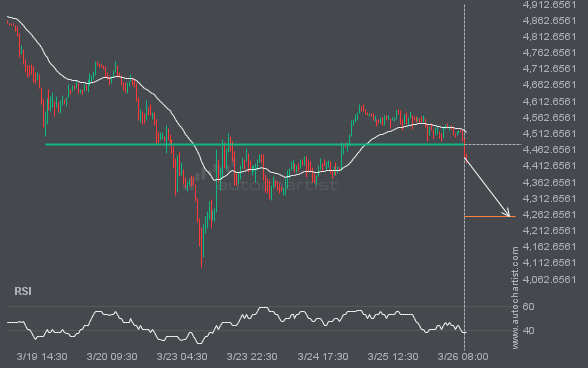
XAUUSD has broken through a support line. Since it has previously retraced from this price, wait for confirmation of the breakout before trading. It has touched this line several times over the past 7 days. This suggests a possible target around 4257.3154 within the next 2 days.
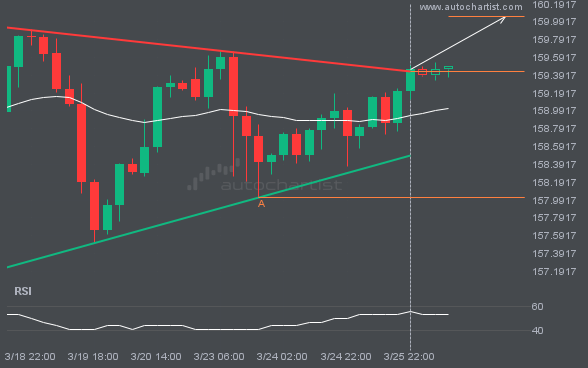
USDJPY has broken through the resistance line of a Triangle technical chart pattern. Because it has retraced from this line in the past, you should wait for confirmation of the breakout before taking any action. It has touched this line twice in the last 10 days, which suggests a possible target around 160.0510 within the […]
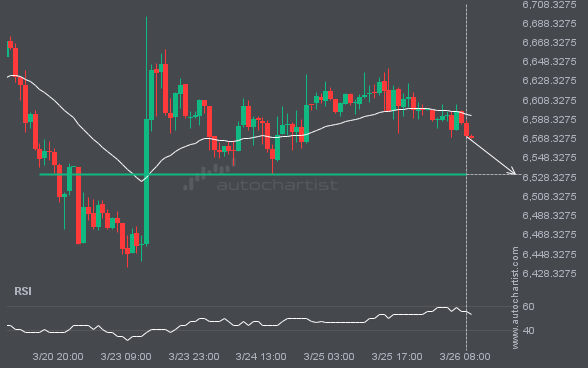
S&P500 is moving toward a key support level at 6530.6899. This level has been tested before for S&P500. This may present a good trading opportunity either at the spot price or after a breakout through this level.
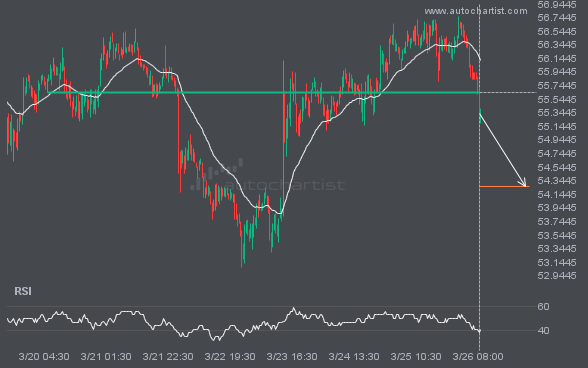
LTCUSD has broken through a support line. Since it has previously retraced from this price, wait for confirmation of the breakout before trading. It has touched this line several times over the past 7 days. This suggests a possible target around 54.2660 within the next 2 days.