Skip to content
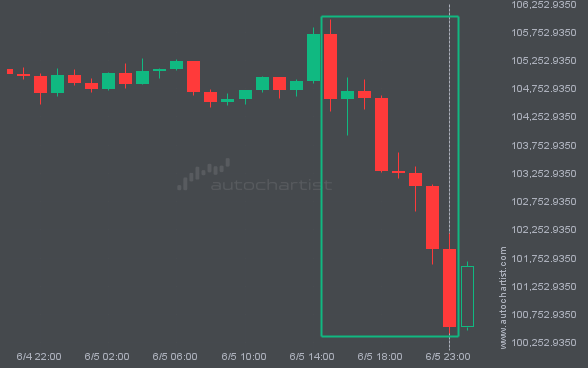
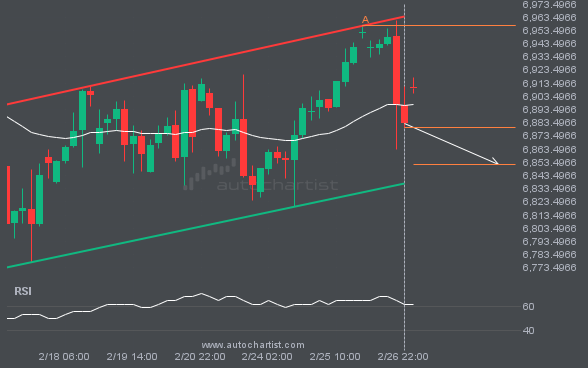
 BTCUSD dropped sharply for 8 hours – which is an excessively big movement for this instrument; exceeding the 98% of past price moves. Even if this move is a sign of a new trend in BTCUSD there is a chance that we will witness a correction, no matter how brief.