MARKET ANALYSIS

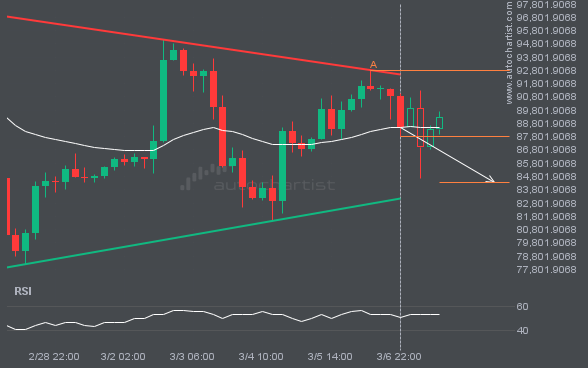
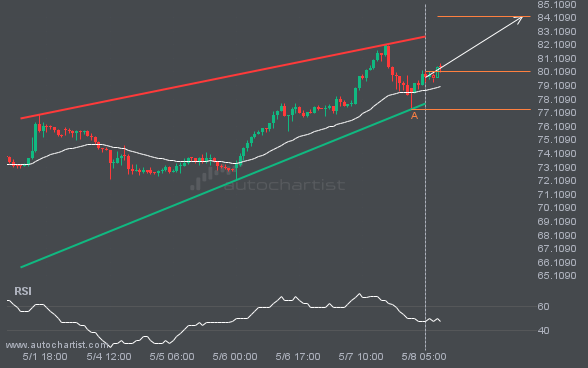
BTCUSD was identified at around 87818.33 having recently rebounded of the resistance on the 4 hour data interval. Ultimately, the price action of the stock has formed a Triangle pattern. This squeeze may increases the chances of a strong breakout. The projected movement will potentially take the price to around the 84370.5690 level.

The last 3 30 Minutes candles on NGC/USD formed a Triangle pattern and broken out through the pattern lines, indicating a possible bearish movement towards the price level of 4.3422.

EURUSD has moved higher by 1.81% from 1.06183 to 1.08103 in the last 2 days.

S&P500 is moving towards a line of 5881.0898 which it has tested numerous times in the past. We have seen it retrace from this position in the past, so at this stage it isn’t clear whether it will breach this price or rebound as it did before. If S&P500 continues in its current trajectory, we […]

Emerging Rising Wedge detected on GBPJPY – the pattern is an emerging one and has not yet broken through support, but the price is expected to move up over the next few hours. The price at the time the pattern was found was 191.787 and it is expected to move to 192.5005.

LTCUSD has breached the resistance line at 105.2400. It may continue the bullish trend towards 109.2020, or, it may prove to be yet another test of this level.

A strong resistance level has been breached at 31.9950 on the 1 hour XAGUSD chart. Technical Analysis theory forecasts a movement to 32.4764 in the next 22 hours.

FTSE100 was identified at around 8787.69 having recently rebounded of the resistance on the 1 hour data interval. Ultimately, the price action of the stock has formed a Triangle pattern. This squeeze may increases the chances of a strong breakout. The projected movement will potentially take the price to around the 8769.6346 level.