MARKET ANALYSIS

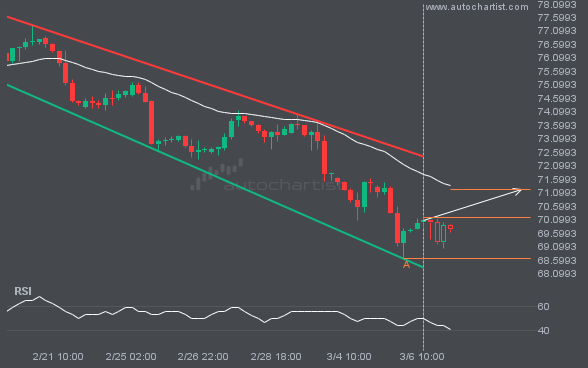
Emerging Channel Down detected on BRN/USD – the pattern is an emerging one and has not yet broken through support, but the price is expected to move up over the next few hours. The price at the time the pattern was found was 70.1825 and it is expected to move to 71.2242.

The price of NGC/USD in heading in the direction of 3.3260. Despite the recent breakout through 3.4305 it is possible that it will struggle to gain momentum to the forecast price and move back in the other direction. This has happened many times in the past so watch for a possible bounce back.

EURUSD has moved lower by 2.85% from 1.151425 to 1.11858 in the last 24 days.

The price of LTCUSD in heading back to the support area. It is possible that it will struggle to break through it and move back in the other direction. The price may eventually break through, but typically the price retreats from the level a number of times before doing so.

Emerging Rising Wedge pattern in its final wave was identified on the XAGUSD 1 hour chart. After a strong bullish run, we find XAGUSD heading towards the upper triangle line with a possible resistance at 33.5981. If the resistance shows to hold, the Rising Wedge pattern suggests a rebound back towards current levels.

FTSE100 is approaching the resistance line of a Ascending Triangle. It has touched this line numerous times in the last 7 days. If it tests this line again, it should do so in the next 9 hours.

The last 6 1 hour candles on GBPJPY formed a Rising Wedge pattern and broken out through the pattern lines, indicating a possible bearish movement towards the price level of 194.9349.