Skip to content
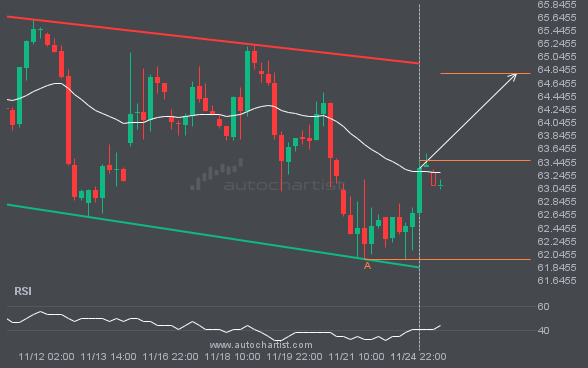
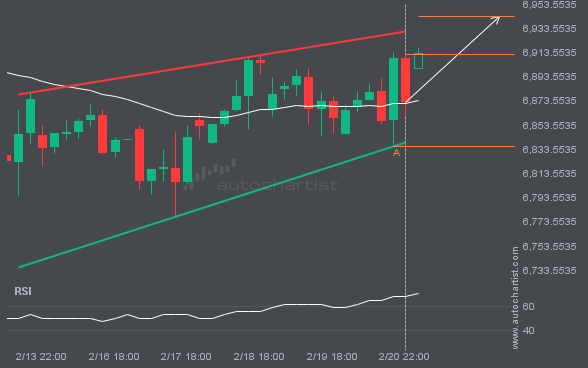
 BRN/USD is heading toward the resistance line of a Channel Down pattern and could reach it within the next 3 days. It has tested this line numerous times before, and this time may be no different, ending in a rebound instead of a breakout. If a breakout doesn’t occur, we could see a retracement back to current levels.