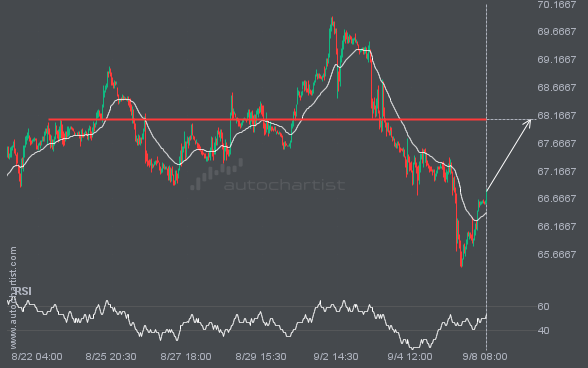
BRN/USD is heading towards a line of 68.0950. If this movement continues, the price of BRN/USD could test 68.0950 within the next 3 days. But don’t be so quick to trade, it has tested this line numerous times in the past, so this movement could be short-lived and end up rebounding.