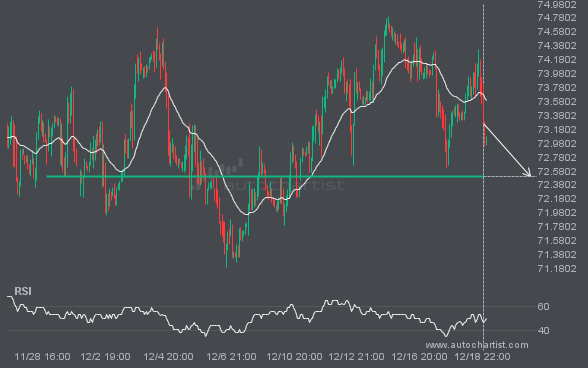
BRN/USD is about to retest a key horizontal support level near 72.5015. It has tested this level 6 times in the recent past and could simply bounce off like it did last time. However, after this many tries, maybe it’s ready to start a new trend.
 Skip to content
 BRN/USD is about to retest a key horizontal support level near 72.5015. It has tested this level 6 times in the recent past and could simply bounce off like it did last time. However, after this many tries, maybe it’s ready to start a new trend.
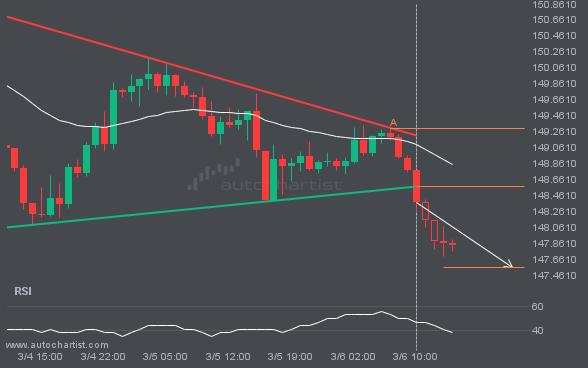
The last 3 1 hour candles on USDJPY formed a Triangle pattern and broken out through the pattern lines, indicating a possible bearish movement towards the price level of 147.5667.
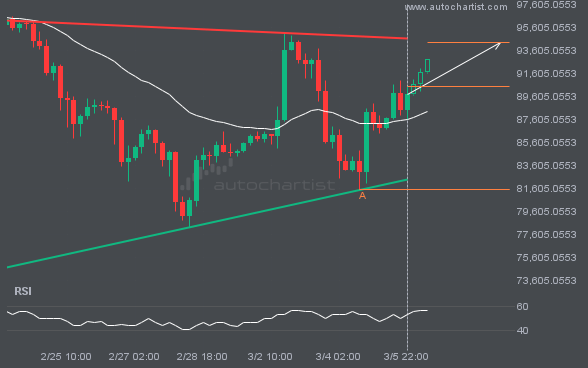
A Ascending Triangle pattern was identified on BTCUSD at 90465.84, creating an expectation that it may move to the resistance line at 94254.8397. It may break through that line and continue the bullish trend or it may reverse from that line.
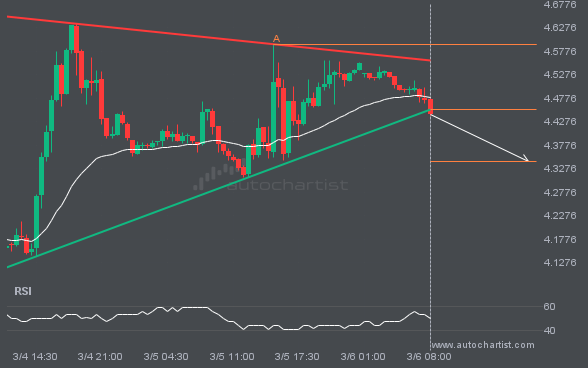
The last 3 30 Minutes candles on NGC/USD formed a Triangle pattern and broken out through the pattern lines, indicating a possible bearish movement towards the price level of 4.3422.
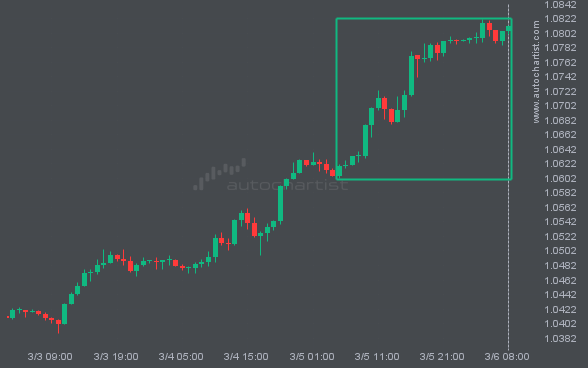
EURUSD has moved higher by 1.81% from 1.06183 to 1.08103 in the last 2 days.
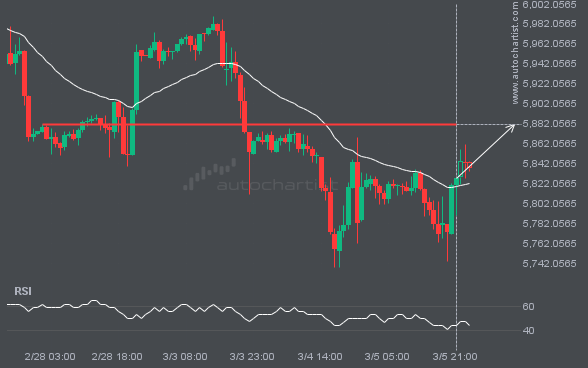
S&P500 is moving towards a line of 5881.0898 which it has tested numerous times in the past. We have seen it retrace from this position in the past, so at this stage it isn’t clear whether it will breach this price or rebound as it did before. If S&P500 continues in its current trajectory, we […]
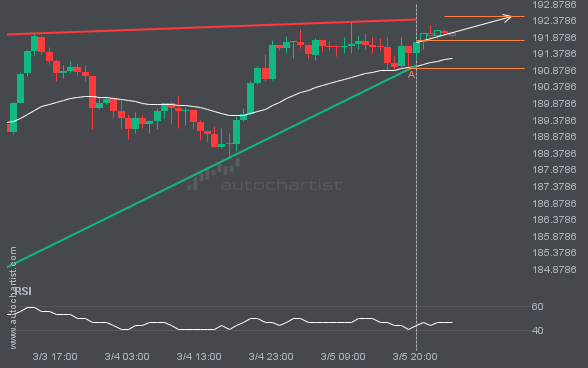
Emerging Rising Wedge detected on GBPJPY – the pattern is an emerging one and has not yet broken through support, but the price is expected to move up over the next few hours. The price at the time the pattern was found was 191.787 and it is expected to move to 192.5005.

LTCUSD has breached the resistance line at 105.2400. It may continue the bullish trend towards 109.2020, or, it may prove to be yet another test of this level.