...
MARKET ANALYSIS

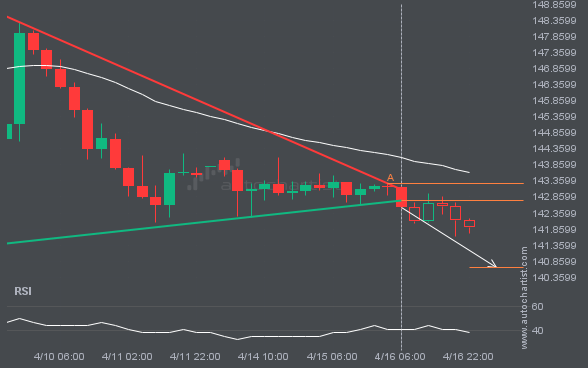
USDJPY has broken through a support line of a Triangle chart pattern. If this breakout holds true, we may see the price of USDJPY testing 140.6664 within the next 15 hours. But don’t be so quick to trade, it has tested this line in the past, so you should confirm the breakout before taking any action.

An emerging Triangle has been detected on LTCUSD on the 4 hour chart. There is a possible move towards 74.4443 next few candles. Once reaching resistance it may continue its bearish run or reverse back to current price levels.

NGC/USD is trapped in a Falling Wedge formation, implying that a breakout is Imminent. This is a great trade-setup for both trend and swing traders. It is now approaching a resistance line that has been tested in the past. Divergence opportunists may be very optimistic about a possible breakout and this may be the start […]

EURUSD is approaching a resistance line at 1.1413. If it hits the resistance line, it may break through this level to continue the bullish trend, or it may turn around back to current levels.

This trade setup on S&P500 is formed by a period of consolidation; a period in which the price primarily moves sideways before choosing a new direction for the longer term. Because of the bullish breakout through resistance, it seems to suggest that we could see the next price move to 5385.4312.

Emerging Ascending Triangle pattern in its final wave was identified on the ETHUSD 4 hour chart. After a strong bullish run, we find ETHUSD heading towards the upper triangle line with a possible resistance at 1693.7896. If the resistance shows to hold, the Ascending Triangle pattern suggests a rebound back towards current levels.

XAGUSD is approaching a support line at 32.0875. If it hits the support line, it may break through this level to continue the bearish trend, or it may turn around back to current levels.