Autochartist General
MARKET ANALYSIS

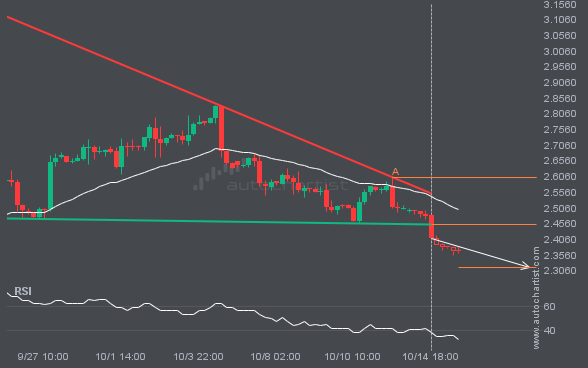
NGC/USD has broken through a support line. It has touched this line at least twice in the last 21 days. This breakout may indicate a potential move to 2.3168 within the next 4 days. Because we have seen it retrace from this position in the past, one should wait for confirmation of the breakout before trading.
GBPJPY is approaching the resistance line of a Rising Wedge. It has touched this line numerous times in the last

S&P500 has breached the resistance line at 5772.2700. It may continue the bullish trend towards 5818.0278, or, it may prove

BTCUSD is moving towards a resistance line. Because we have seen it retrace from this line before, we could see

FTSE100 is en route to a very important line that will be a definite deciding factor of what is to

NAS100 has broken through the resistance line of a Triangle technical chart pattern. Because we have seen it retrace from

The last 2 1 hour candles on XAGUSD formed a Triangle pattern and broken out through the pattern lines, indicating

ETHUSD is heading towards the support line of a Triangle. If this movement continues, the price of ETHUSD could test